
Como instalar e configurar o Prometheus no Linux? (Ubuntu e CentOS)
Publicados: 2019-08-26
O que é Prometeu?
O Prometheus é um sistema de monitoramento de classe mundial que vem com o banco de dados de séries temporais como padrão. É um sistema de código aberto originalmente construído no ano de 2012.
As 500 maiores empresas do mundo têm usado o Prometheus para coletar métricas para sua infraestrutura e aplicativos. O Prometheus suporta modelos de dados multidimensionais com dados de séries temporais que são identificados principalmente como Métricas.
Não há nenhum requisito especial de armazenamento de dados, pois o Prometheus usa parte do Time Series DB (TSDB) de sua própria instalação.
Neste tutorial vamos instalar o Prometheus no Linux Ubuntu e CentOS com passos super simples.
Vamos começar:
Etapa 1 Verifique a versão do sistema operacional Linux
Comando: cat /etc/os-release
|
1 2 3 4 5 6 7 8 9 10 11 12 13 |
root @ localhost : ~ # cat /etc/os-release NAME = "Ubuntu" VERSION = "19.04 (Disco Dingo)" ID = ubuntu ID_LIKE = debian PRETTY_NAME = "Ubuntu 19.04" VERSION_ID = "19.04" HOME_URL = "https://www.ubuntu.com/" SUPPORT_URL = "https://help.ubuntu.com/" BUG_REPORT_URL = "https://bugs.launchpad.net/ubuntu/" PRIVACY_POLICY_URL = "https://www.ubuntu.com/legal/terms-and-policies/privacy-policy" VERSION_CODENAME = disco UBUNTU_CODENAME = disco |
As etapas abaixo se aplicam ao Ubuntu Linux OS .
Etapa 2 Criar dados do Prometheus e pasta de configuração
Comandos :
|
1 2 3 |
root @ localhost : ~ # sudo mkdir /crunchify/prometheus/conf root @ localhost : ~ # sudo mkdir /crunchify/prometheus/data |
Vamos verificar as duas pastas:
|
1 2 3 4 5 6 7 8 9 |
root @ localhost : / crunchify / prometheus # pwd / crunchify / prometheus root @ localhost : / crunchify / prometheus # ls -ltra total 16 drwxr - xr - x 2 root root 4096 Aug 25 23 : 37 conf drwxr - xr - x 3 root root 4096 Aug 25 23 : 37 . . drwxr - xr - x 2 root root 4096 Aug 25 23 : 37 data drwxr - xr - x 4 root root 4096 Aug 25 23 : 37 . |
Etapa 3 Alterar a propriedade da pasta de dados
Isso é necessário para evitar problemas de permissão nas etapas posteriores.
|
1 |
root @ localhost : / crunchify / prometheus # sudo chown 65534:65534 /crunchify/prometheus/data/ |
Etapa 4 Crie o arquivo prometheus.yml
Vá para a pasta /crunchify/prometheus/conf e crie o arquivo prometheus.yml .
|
1 2 3 |
root @ localhost : / # cd /crunchify/prometheus/conf root @ localhost : / crunchify / prometheus / conf # vi prometheus.yml |
conteúdo do arquivo prometheus.yml:
|
1 2 3 4 5 6 7 8 9 10 11 12 13 14 15 16 17 18 19 20 21 22 23 24 25 26 27 28 29 |
# my global config global : scrape_interval : 15s # Set the scrape interval to every 15 seconds. Default is every 1 minute. evaluation_interval : 15s # Evaluate rules every 15 seconds. The default is every 1 minute. # scrape_timeout is set to the global default (10s). # Alertmanager configuration alerting : alertmanagers : - static_configs : - targets : # - alertmanager:9093 # Load rules once and periodically evaluate them according to the global 'evaluation_interval'. rule_files : # - "first_rules.yml" # - "second_rules.yml" # A scrape configuration containing exactly one endpoint to scrape: # Here it's Prometheus itself. scrape_configs : # The job name is added as a label `job=<job_name>` to any time series scraped from this config. - job_name : 'prometheus' # metrics_path defaults to '/metrics' # scheme defaults to 'http'. static_configs : - targets : [ '65.19.71.11:9090' ] |
Note: No arquivo acima – substitua o IP pelo IP do seu host/VM.
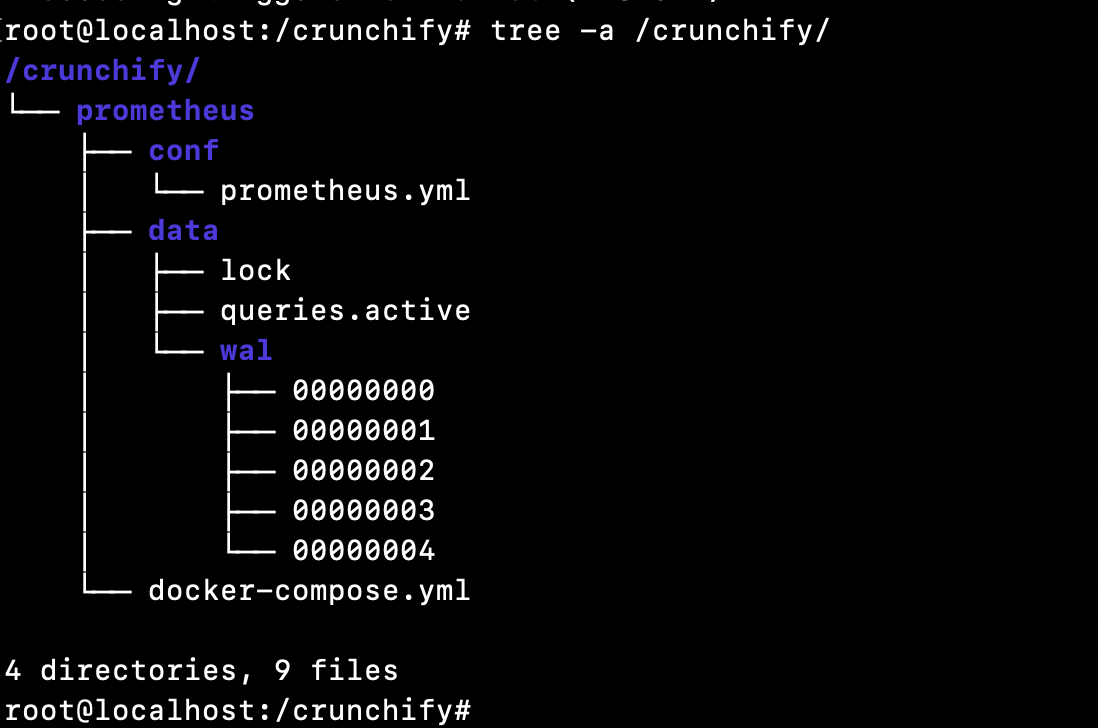
Aqui está uma Directory structure para este tutorial:
Etapa 5 Verifique se você instalou o Docker em sua VM.
Como verificar se o Docker está instalado ou não?
|
1 2 3 |
root @ localhost : ~ # docker Command 'docker' not found |
Isso significa que o docker não está instalado em seu host/VM. Siga o tutorial de instalação do Docker completamente para instalar o Docker em seu host/VM.
Etapa 6 Instalar o Docker Compose
Pre-requisiteé instalar o Docker primeiro antes de executar as etapas abaixo. (Passo-5)
Execute abaixo três comandos:
|
1 2 3 4 5 6 7 8 9 |
root @ localhost : ~ # sudo curl -L "https://github.com/docker/compose/releases/download/1.24.1/docker-compose-$(uname -s)-$(uname -m)" -o /usr/local/bin/docker-compose % Total % Received % Xferd Average Speed Time Time Time Current Dload Upload Total Spent Left Speed 100 617 0 617 0 0 2448 0 -- : -- : -- -- : -- : -- -- : -- : -- 2448 100 15.4M 100 15.4M 0 0 11.2M 0 0 : 00 : 01 0 : 00 : 01 -- : -- : -- 15.7M root @ localhost : ~ # sudo chmod +x /usr/local/bin/docker-compose root @ localhost : ~ # sudo ln -s /usr/local/bin/docker-compose /usr/bin/docker-compose |
Etapa 7 Verificar a versão do Docker Compose
|
1 2 3 |
root @ localhost : ~ # docker-compose --version docker - compose version 1.24.1 , build 4667896b |
Parabéns – o docker compose foi instalado com sucesso em sua VM.
Etapa 8 Criar arquivo docker-compose.yml
Vá para a pasta /crunchify/prometheus.
|
1 2 3 |
root @ localhost : / crunchify # cd /crunchify/prometheus/ root @ localhost : / crunchify / prometheus # vi docker-compose.yml |
conteúdo do arquivo docker-compose.yml:
|
1 2 3 4 5 6 7 8 9 10 11 12 13 14 |
version : "3" services : prometheus : image : prom / prometheus : latest container_name : prometheus volumes : - / crunchify / prometheus / conf : / etc / prometheus - / crunchify / prometheus / data : / prometheus command : - '--config.file=/etc/prometheus/prometheus.yml' - '--storage.tsdb.path=/prometheus' ports : - "9090:9090" |
Etapa 9 Instale o Prometheus Start/Stop como parte do controle do sistema.
Crie o arquivo vi /etc/systemd/system/prometheus.service
conteúdo do arquivo prometheus.service:
|
1 2 3 4 5 6 7 8 9 10 11 12 13 14 15 16 17 |
[ Unit ] Description = Prometheus monitoring docker container After = docker . service BindsTo = docker . service [ Service ] Restart = always WorkingDirectory =/ crunchify / prometheus / # Ubuntu ExecStart =/ usr / bin / docker - compose up ExecStop =/ usr / bin / docker - compose down # CentOS #ExecStart=/usr/bin/docker-compose up #ExecStop=/usr/bin/docker-compose down [ Install ] WantedBy = multi - user . target |

Etapa 10 Iniciar o serviço Prometheus
|
1 2 3 4 5 6 |
root @ localhost : / crunchify / prometheus / config # sudo systemctl daemon-reload root @ localhost : / crunchify / prometheus / config # sudo systemctl enable prometheus Created symlink / etc / systemd / system / multi - user . target . wants / prometheus . service → / etc / systemd / system / prometheus . service . root @ localhost : / crunchify / prometheus / config # sudo systemctl start prometheus |
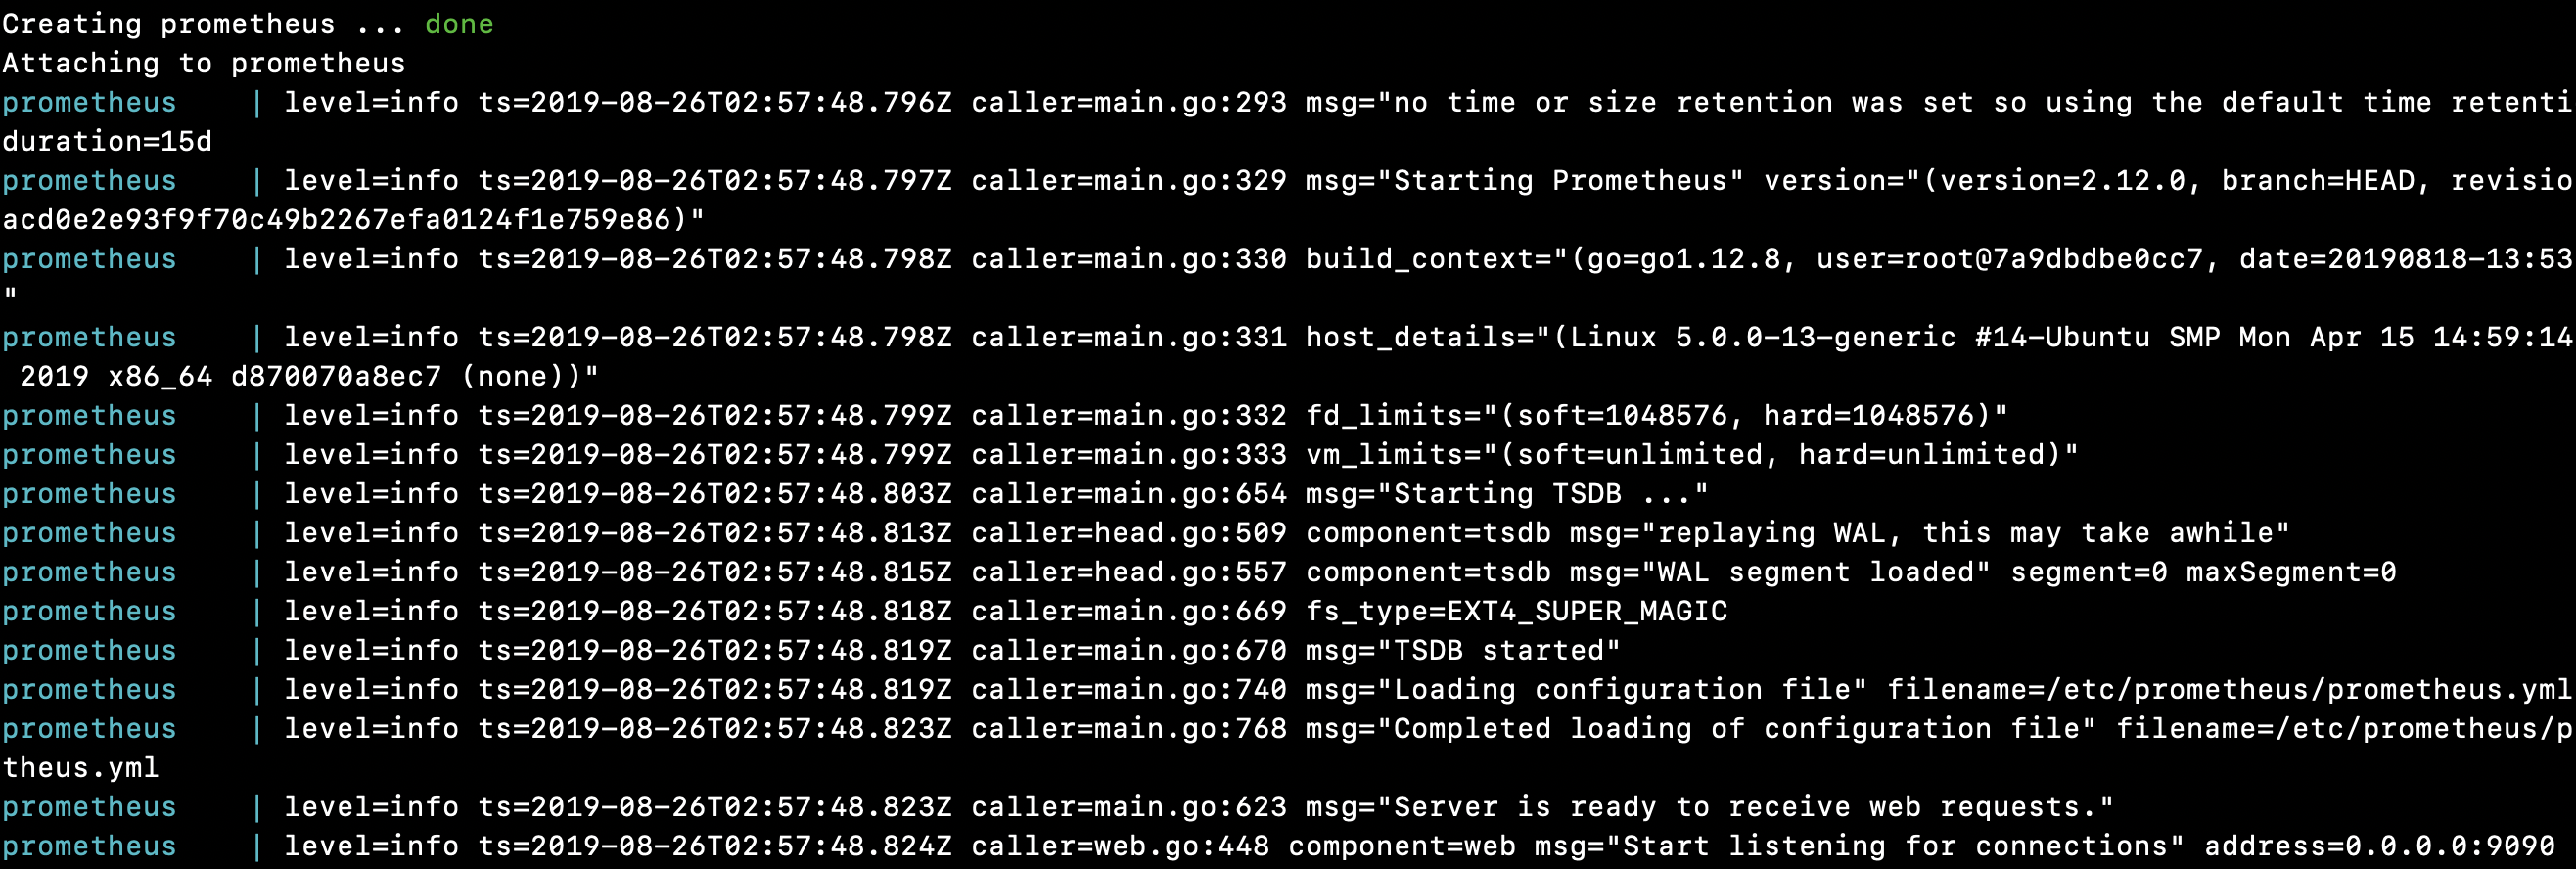
Servidor Prometheus iniciado no Linux:
|
1 2 3 4 5 6 7 8 9 10 11 12 13 14 15 16 17 18 19 20 21 22 23 24 25 26 27 28 29 30 31 32 |
root @ localhost : / crunchify / prometheus # sudo systemctl start prometheus Creating network "prometheus_default" with the default driver Pulling prometheus ( prom / prometheus : latest ) . . . latest : Pulling from prom / prometheus 8e674ad76dce : Pull complete e77d2419d1c2 : Pull complete d7c0a2a2ca7e : Pull complete bd46de67c79d : Pull complete 35f6078df7e9 : Pull complete 8b3f04e26151 : Pull complete 9d234d9c8a77 : Pull complete 1a8a2a4f314d : Pull complete 62e28fd716ec : Pull complete Digest : sha256 : cd93b8711bb92eb9c437d74217311519e0a93bc55779aa664325dc83cd13cb32 Status : Downloaded newer image for prom / prometheus : latest Creating prometheus . . . done Attaching to prometheus prometheus | level = info ts = 2019 - 08 - 26T02 : 57 : 48.796Z caller = main . go : 293 msg = "no time or size retention was set so using the default time retention" duration = 15d prometheus | level = info ts = 2019 - 08 - 26T02 : 57 : 48.797Z caller = main . go : 329 msg = "Starting Prometheus" version = "(version=2.12.0, branch=HEAD, revision=43acd0e2e93f9f70c49b2267efa0124f1e759e86)" prometheus | level = info ts = 2019 - 08 - 26T02 : 57 : 48.798Z caller = main . go : 330 build_context = "(go=go1.12.8, user=root@7a9dbdbe0cc7, date=20190818-13:53:16)" prometheus | level = info ts = 2019 - 08 - 26T02 : 57 : 48.798Z caller = main . go : 331 host_details = "(Linux 5.0.0-13-generic #14-Ubuntu SMP Mon Apr 15 14:59:14 UTC 2019 x86_64 d870070a8ec7 (none))" prometheus | level = info ts = 2019 - 08 - 26T02 : 57 : 48.799Z caller = main . go : 332 fd_limits = "(soft=1048576, hard=1048576)" prometheus | level = info ts = 2019 - 08 - 26T02 : 57 : 48.799Z caller = main . go : 333 vm_limits = "(soft=unlimited, hard=unlimited)" prometheus | level = info ts = 2019 - 08 - 26T02 : 57 : 48.803Z caller = main . go : 654 msg = "Starting TSDB ..." prometheus | level = info ts = 2019 - 08 - 26T02 : 57 : 48.813Z caller = head . go : 509 component = tsdb msg = "replaying WAL, this may take awhile" prometheus | level = info ts = 2019 - 08 - 26T02 : 57 : 48.815Z caller = head . go : 557 component = tsdb msg = "WAL segment loaded" segment = 0 maxSegment = 0 prometheus | level = info ts = 2019 - 08 - 26T02 : 57 : 48.818Z caller = main . go : 669 fs_type = EXT4_SUPER_MAGIC prometheus | level = info ts = 2019 - 08 - 26T02 : 57 : 48.819Z caller = main . go : 670 msg = "TSDB started" prometheus | level = info ts = 2019 - 08 - 26T02 : 57 : 48.819Z caller = main . go : 740 msg = "Loading configuration file" filename =/ etc / prometheus / prometheus . yml prometheus | level = info ts = 2019 - 08 - 26T02 : 57 : 48.823Z caller = main . go : 768 msg = "Completed loading of configuration file" filename =/ etc / prometheus / prometheus . yml prometheus | level = info ts = 2019 - 08 - 26T02 : 57 : 48.823Z caller = main . go : 623 msg = "Server is ready to receive web requests." prometheus | level = info ts = 2019 - 08 - 26T02 : 57 : 48.824Z caller = web . go : 448 component = web msg = "Start listening for connections" address = 0.0.0.0 : 9090 |
Parabéns!! Você iniciou o Prometheus com sucesso em seu host.
Vamos brincar com o painel e a interface do usuário do Prometheus
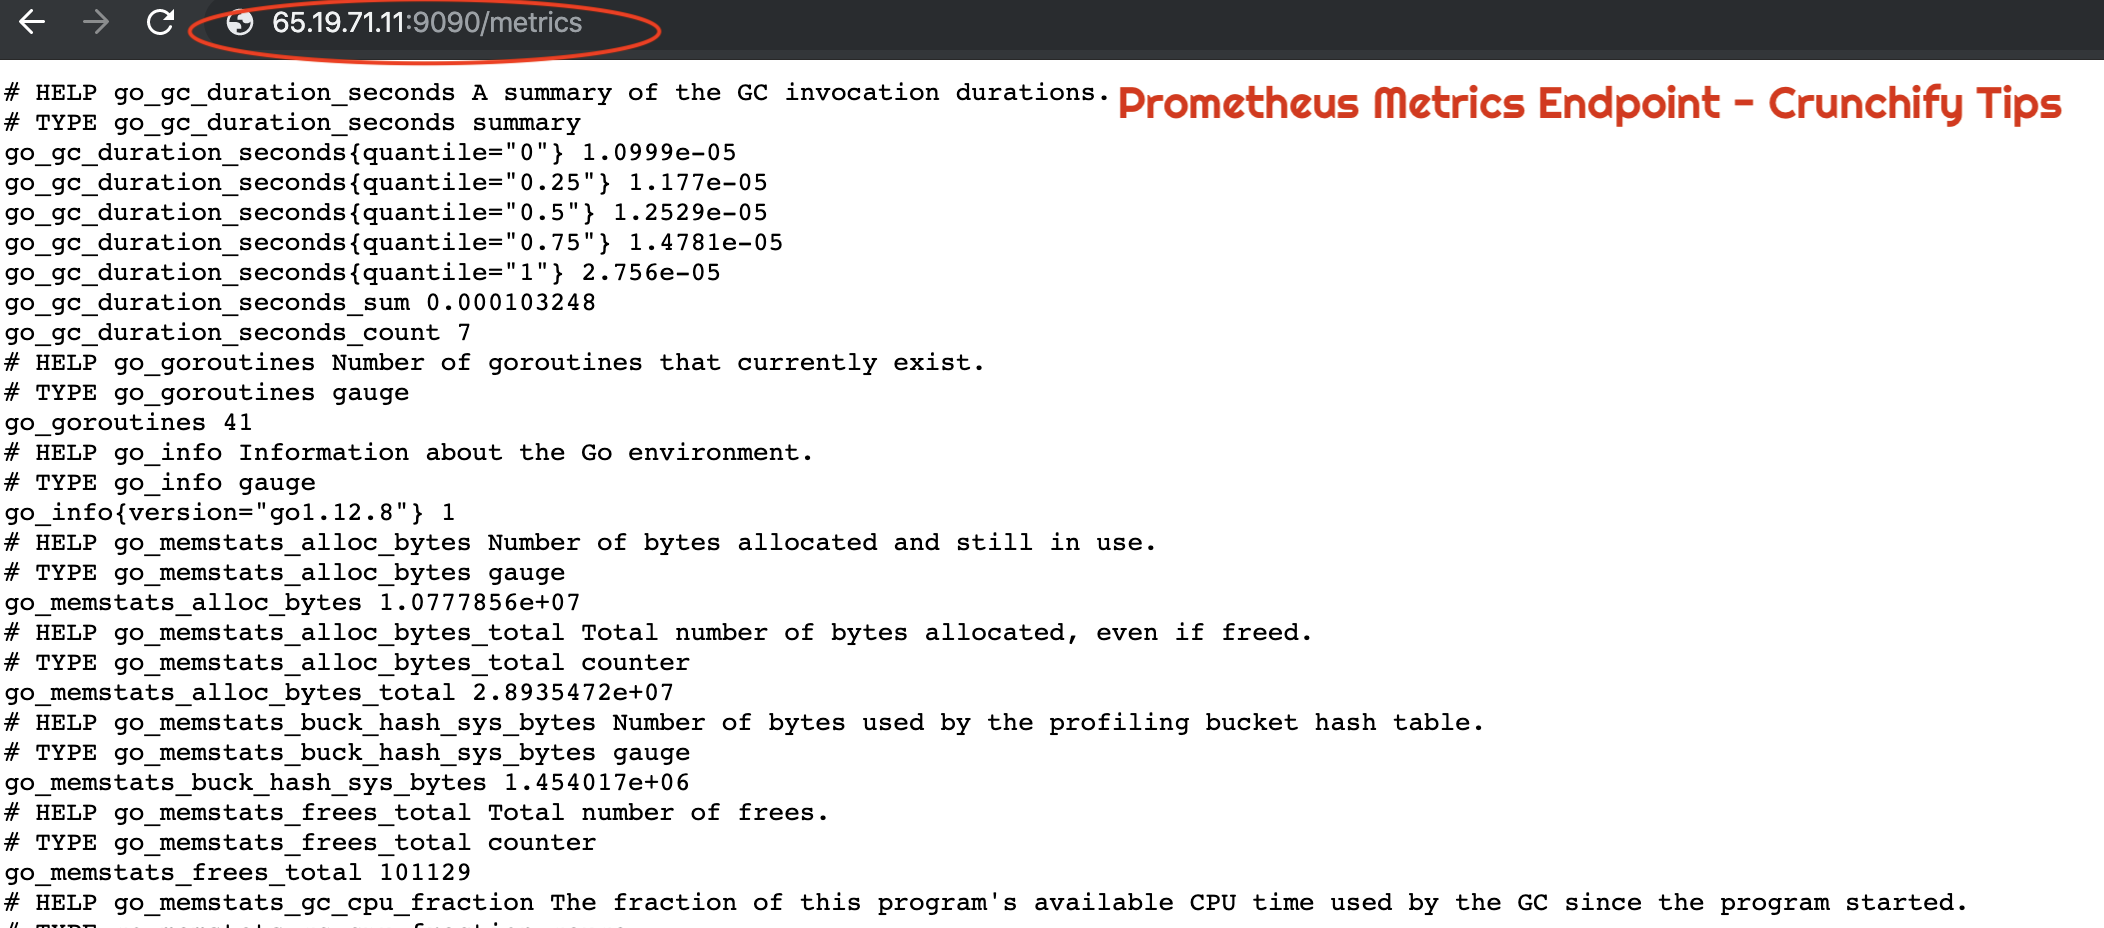
Como verificar se o Prometheus está funcionando corretamente ou não?
|
1 |
URL : http : //65.19.71.11:9090/metrics |
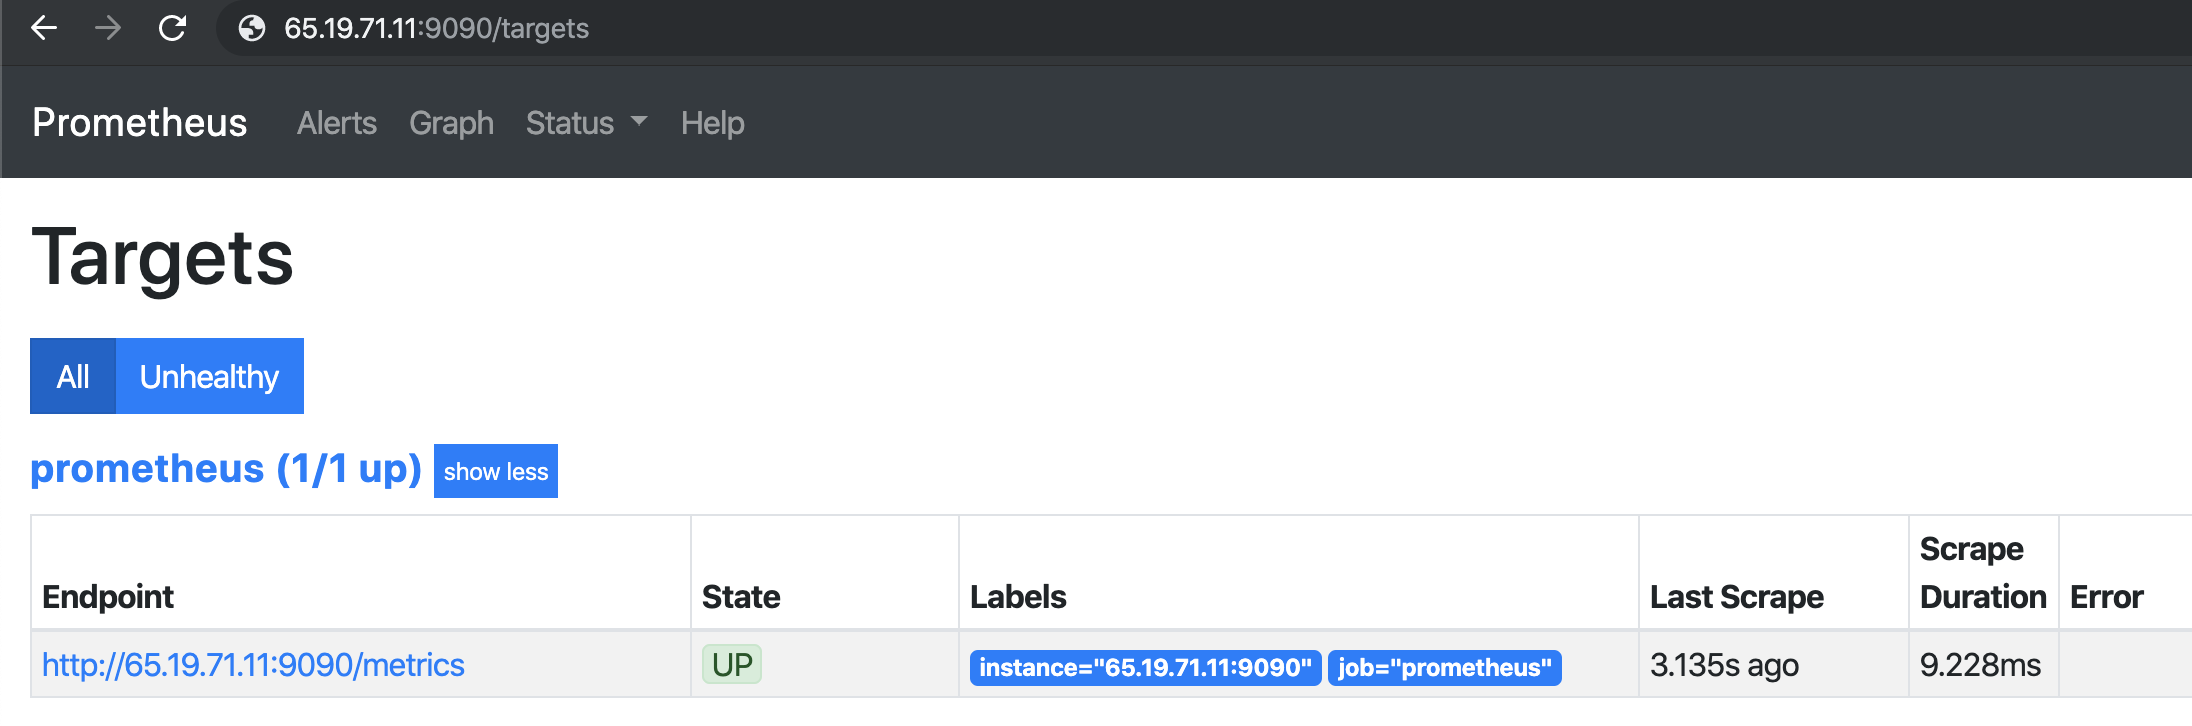
Como verificar o status UP do Host ou da VM usando o Prometheus?
|
1 |
URL : http : //65.19.71.11:9090/targets |
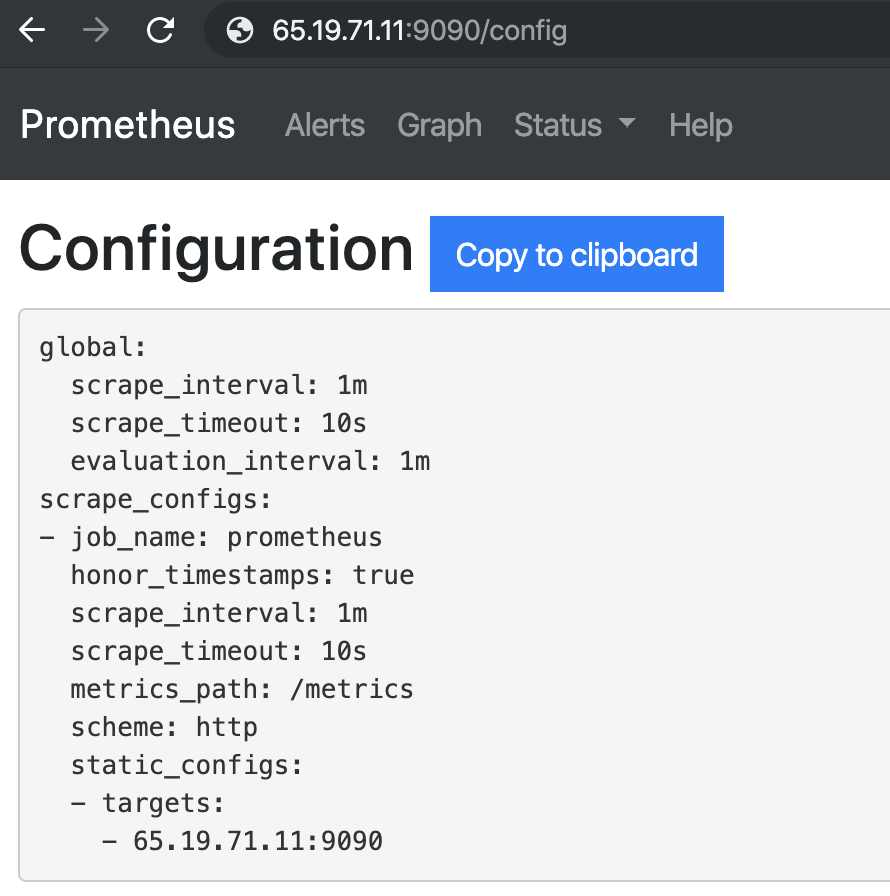
Como verificar a configuração do Prometheus no navegador?
Informações de tempo de execução do Prometheus
|
1 |
URL : http : //65.19.71.11:9090/status |
| Tempo de atividade | 26/08/2019 03:07:24.244852166 +0000 UTC |
|---|---|
| Diretório de trabalho | /Prometeu |
| Recarregamento de configuração | Bem sucedido |
| Última recarga de configuração bem-sucedida | 26/08/2019 03:07:24 +0000 UTC |
| Pedaços de cabeça | 533 |
| Série temporal principal | 533 |
| Corrupções do WAL | 0 |
| Goroutines | 36 |
| GOMAXPROCS | 1 |
| GOGC | |
| GODEBUG | |
| Retenção de armazenamento | 15d |
Informações de compilação do Prometheus
| Versão | 2.12.0 |
|---|---|
| Revisão | 43acd0e2e93f9f70c49b2267efa0124f1e759e86 |
| Ramo | CABEÇA |
| BuildUser | root@7a9dbdbe0cc7 |
| Data de construção | 20190818-13:53:16 |
| GoVersion | ir1.12.8 |
Sinalizadores de linha de comando do Prometheus:
|
1 |
URL : http : //65.19.71.11:9090/flags |
| alertmanager.notification-queue-capacity | 10.000 |
|---|---|
| alertmanager.timeout | 10s |
| config.file | /etc/prometheus/prometheus.yml |
| log.format | logfmt |
| nível de log | informação |
| query.lookback-delta | 5m |
| query.max-simultaneidade | 20 |
| query.max-amostras | 50000000 |
| Tempo de consulta Expirado | 2m |
| regras.alerta.para-período de carência | 10m |
| regras.alerta.para-tolerância-interrupção | 1h |
| regras.alerta.reenviar-atraso | 1m |
| prazo de armazenamento.remote.flush | 1m |
| storage.remote.read-concurrent-limit | 10 |
| storage.remote.read-sample-limit | 50000000 |
| storage.tsdb.allow-overlapping-blocks | falso |
| storage.tsdb.max-block-duration | 36h |
| storage.tsdb.min-block-duration | 2h |
| storage.tsdb.no-lockfile | falso |
| storage.tsdb.path | /Prometeu |
| armazenamento.tsdb.retenção | 0s |
| storage.tsdb.retention.size | 0B |
| armazenamento.tsdb.retenção.tempo | 0s |
| storage.tsdb.wal-compression | falso |
| storage.tsdb.wal-segment-size | 0B |
| web.console.libraries | console_libraries |
| web.console.templates | consoles |
| web.cors.origin | .* |
| web.enable-admin-api | falso |
| web.enable-lifecycle | falso |
| web.external-url | |
| web.listen-address | 0.0.0.0:9090 |
| conexões web.max | 512 |
| web.page-title | Servidor de Coleta e Processamento de Séries Temporais Prometheus |
| web.read-timeout | 5m |
| web.route-prefix | / |
E você está tudo pronto. Você successfully installed Prometheus e verificou todos os seus recursos.