
如何在 Linux 上安装和配置 Prometheus? (Ubuntu 和 CentOS)
已发表: 2019-08-26
什么是普罗米修斯?
Prometheus 是世界一流的监控系统,默认带有时间序列数据库。 它是最初于 2012 年构建的开源系统。
世界 500 强公司一直在使用 Prometheus 来收集其基础设施和应用程序的指标。 Prometheus 支持多维数据模型,时间序列数据主要标识为 Metrics。
没有特殊的数据存储要求,因为 Prometheus 在其自己的安装中使用了时序Time Series DB (TSDB) 部分。
在本教程中,我们将通过超级简单的步骤在 Linux Ubuntu 和 CentOS 上安装 Prometheus。
让我们开始吧:
Step-1 验证 Linux 操作系统版本
命令: cat /etc/os-release
|
1 2 3 4 5 6 7 8 9 10 11 12 13 |
root @ localhost : ~ # cat /etc/os-release NAME = "Ubuntu" VERSION = "19.04 (Disco Dingo)" ID = ubuntu ID_LIKE = debian PRETTY_NAME = "Ubuntu 19.04" VERSION_ID = "19.04" HOME_URL = "https://www.ubuntu.com/" SUPPORT_URL = "https://help.ubuntu.com/" BUG_REPORT_URL = "https://bugs.launchpad.net/ubuntu/" PRIVACY_POLICY_URL = "https://www.ubuntu.com/legal/terms-and-policies/privacy-policy" VERSION_CODENAME = disco UBUNTU_CODENAME = disco |
以下步骤适用于Ubuntu Linux OS 。
Step-2 创建 Prometheus 数据和配置文件夹
命令:
|
1 2 3 |
root @ localhost : ~ # sudo mkdir /crunchify/prometheus/conf root @ localhost : ~ # sudo mkdir /crunchify/prometheus/data |
让我们验证两个文件夹:
|
1 2 3 4 5 6 7 8 9 |
root @ localhost : / crunchify / prometheus # pwd / crunchify / prometheus root @ localhost : / crunchify / prometheus # ls -ltra total 16 drwxr - xr - x 2 root root 4096 Aug 25 23 : 37 conf drwxr - xr - x 3 root root 4096 Aug 25 23 : 37 . . drwxr - xr - x 2 root root 4096 Aug 25 23 : 37 data drwxr - xr - x 4 root root 4096 Aug 25 23 : 37 . |
Step-3 更改数据文件夹的所有权
这是避免后续步骤中的权限问题所必需的。
|
1 |
root @ localhost : / crunchify / prometheus # sudo chown 65534:65534 /crunchify/prometheus/data/ |
Step-4 创建 prometheus.yml 文件
转到文件夹/crunchify/prometheus/conf并创建文件prometheus.yml 。
|
1 2 3 |
root @ localhost : / # cd /crunchify/prometheus/conf root @ localhost : / crunchify / prometheus / conf # vi prometheus.yml |
prometheus.yml 文件内容:
|
1 2 3 4 5 6 7 8 9 10 11 12 13 14 15 16 17 18 19 20 21 22 23 24 25 26 27 28 29 |
# my global config global : scrape_interval : 15s # Set the scrape interval to every 15 seconds. Default is every 1 minute. evaluation_interval : 15s # Evaluate rules every 15 seconds. The default is every 1 minute. # scrape_timeout is set to the global default (10s). # Alertmanager configuration alerting : alertmanagers : - static_configs : - targets : # - alertmanager:9093 # Load rules once and periodically evaluate them according to the global 'evaluation_interval'. rule_files : # - "first_rules.yml" # - "second_rules.yml" # A scrape configuration containing exactly one endpoint to scrape: # Here it's Prometheus itself. scrape_configs : # The job name is added as a label `job=<job_name>` to any time series scraped from this config. - job_name : 'prometheus' # metrics_path defaults to '/metrics' # scheme defaults to 'http'. static_configs : - targets : [ '65.19.71.11:9090' ] |
Note:在上述文件中 - 将 IP 替换为您的主机/虚拟机 IP。
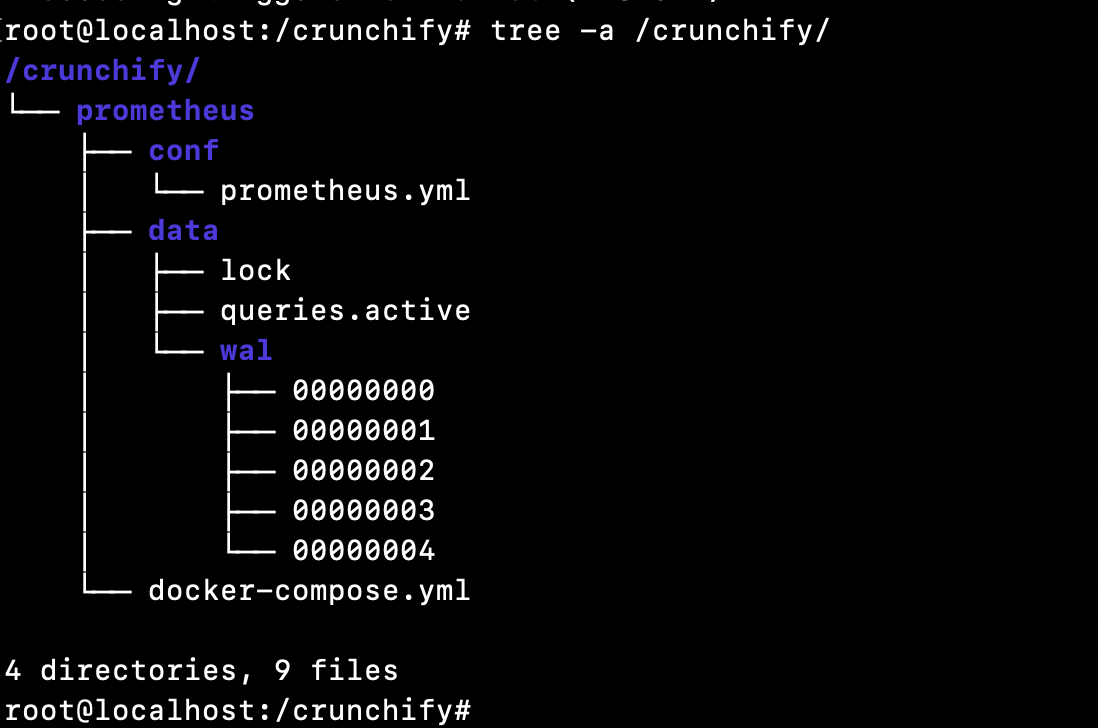
这是本教程的Directory structure :
步骤 5 确保您已在 VM 上安装 Docker。
如何检查 Docker 是否安装?
|
1 2 3 |
root @ localhost : ~ # docker Command 'docker' not found |
这意味着 docker 未安装在您的主机/VM 上。 请完全按照 Docker 安装教程在您的主机/VM 上安装 Docker。
Step-6 安装 Docker Compose
Pre-requisite是在执行以下步骤之前先安装 Docker。 (第 5 步)
执行以下三个命令:
|
1 2 3 4 5 6 7 8 9 |
root @ localhost : ~ # sudo curl -L "https://github.com/docker/compose/releases/download/1.24.1/docker-compose-$(uname -s)-$(uname -m)" -o /usr/local/bin/docker-compose % Total % Received % Xferd Average Speed Time Time Time Current Dload Upload Total Spent Left Speed 100 617 0 617 0 0 2448 0 -- : -- : -- -- : -- : -- -- : -- : -- 2448 100 15.4M 100 15.4M 0 0 11.2M 0 0 : 00 : 01 0 : 00 : 01 -- : -- : -- 15.7M root @ localhost : ~ # sudo chmod +x /usr/local/bin/docker-compose root @ localhost : ~ # sudo ln -s /usr/local/bin/docker-compose /usr/bin/docker-compose |
Step-7 验证 Docker Compose 版本
|
1 2 3 |
root @ localhost : ~ # docker-compose --version docker - compose version 1.24.1 , build 4667896b |
恭喜 - docker compose 已成功安装在您的 VM 上。
Step-8 创建 docker-compose.yml 文件
转到文件夹 /crunchify/prometheus。
|
1 2 3 |
root @ localhost : / crunchify # cd /crunchify/prometheus/ root @ localhost : / crunchify / prometheus # vi docker-compose.yml |
docker-compose.yml 文件内容:
|
1 2 3 4 5 6 7 8 9 10 11 12 13 14 |
version : "3" services : prometheus : image : prom / prometheus : latest container_name : prometheus volumes : - / crunchify / prometheus / conf : / etc / prometheus - / crunchify / prometheus / data : / prometheus command : - '--config.file=/etc/prometheus/prometheus.yml' - '--storage.tsdb.path=/prometheus' ports : - "9090:9090" |
Step-9 安装 Prometheus Start/Stop 作为系统控制的一部分。
创建文件vi /etc/systemd/system/prometheus.service
prometheus.service 文件内容:
|
1 2 3 4 5 6 7 8 9 10 11 12 13 14 15 16 17 |
[ Unit ] Description = Prometheus monitoring docker container After = docker . service BindsTo = docker . service [ Service ] Restart = always WorkingDirectory =/ crunchify / prometheus / # Ubuntu ExecStart =/ usr / bin / docker - compose up ExecStop =/ usr / bin / docker - compose down # CentOS #ExecStart=/usr/bin/docker-compose up #ExecStop=/usr/bin/docker-compose down [ Install ] WantedBy = multi - user . target |

Step-10 启动 Prometheus 服务
|
1 2 3 4 5 6 |
root @ localhost : / crunchify / prometheus / config # sudo systemctl daemon-reload root @ localhost : / crunchify / prometheus / config # sudo systemctl enable prometheus Created symlink / etc / systemd / system / multi - user . target . wants / prometheus . service → / etc / systemd / system / prometheus . service . root @ localhost : / crunchify / prometheus / config # sudo systemctl start prometheus |
Prometheus 服务器在 Linux 上启动:
|
1 2 3 4 5 6 7 8 9 10 11 12 13 14 15 16 17 18 19 20 21 22 23 24 25 26 27 28 29 30 31 32 |
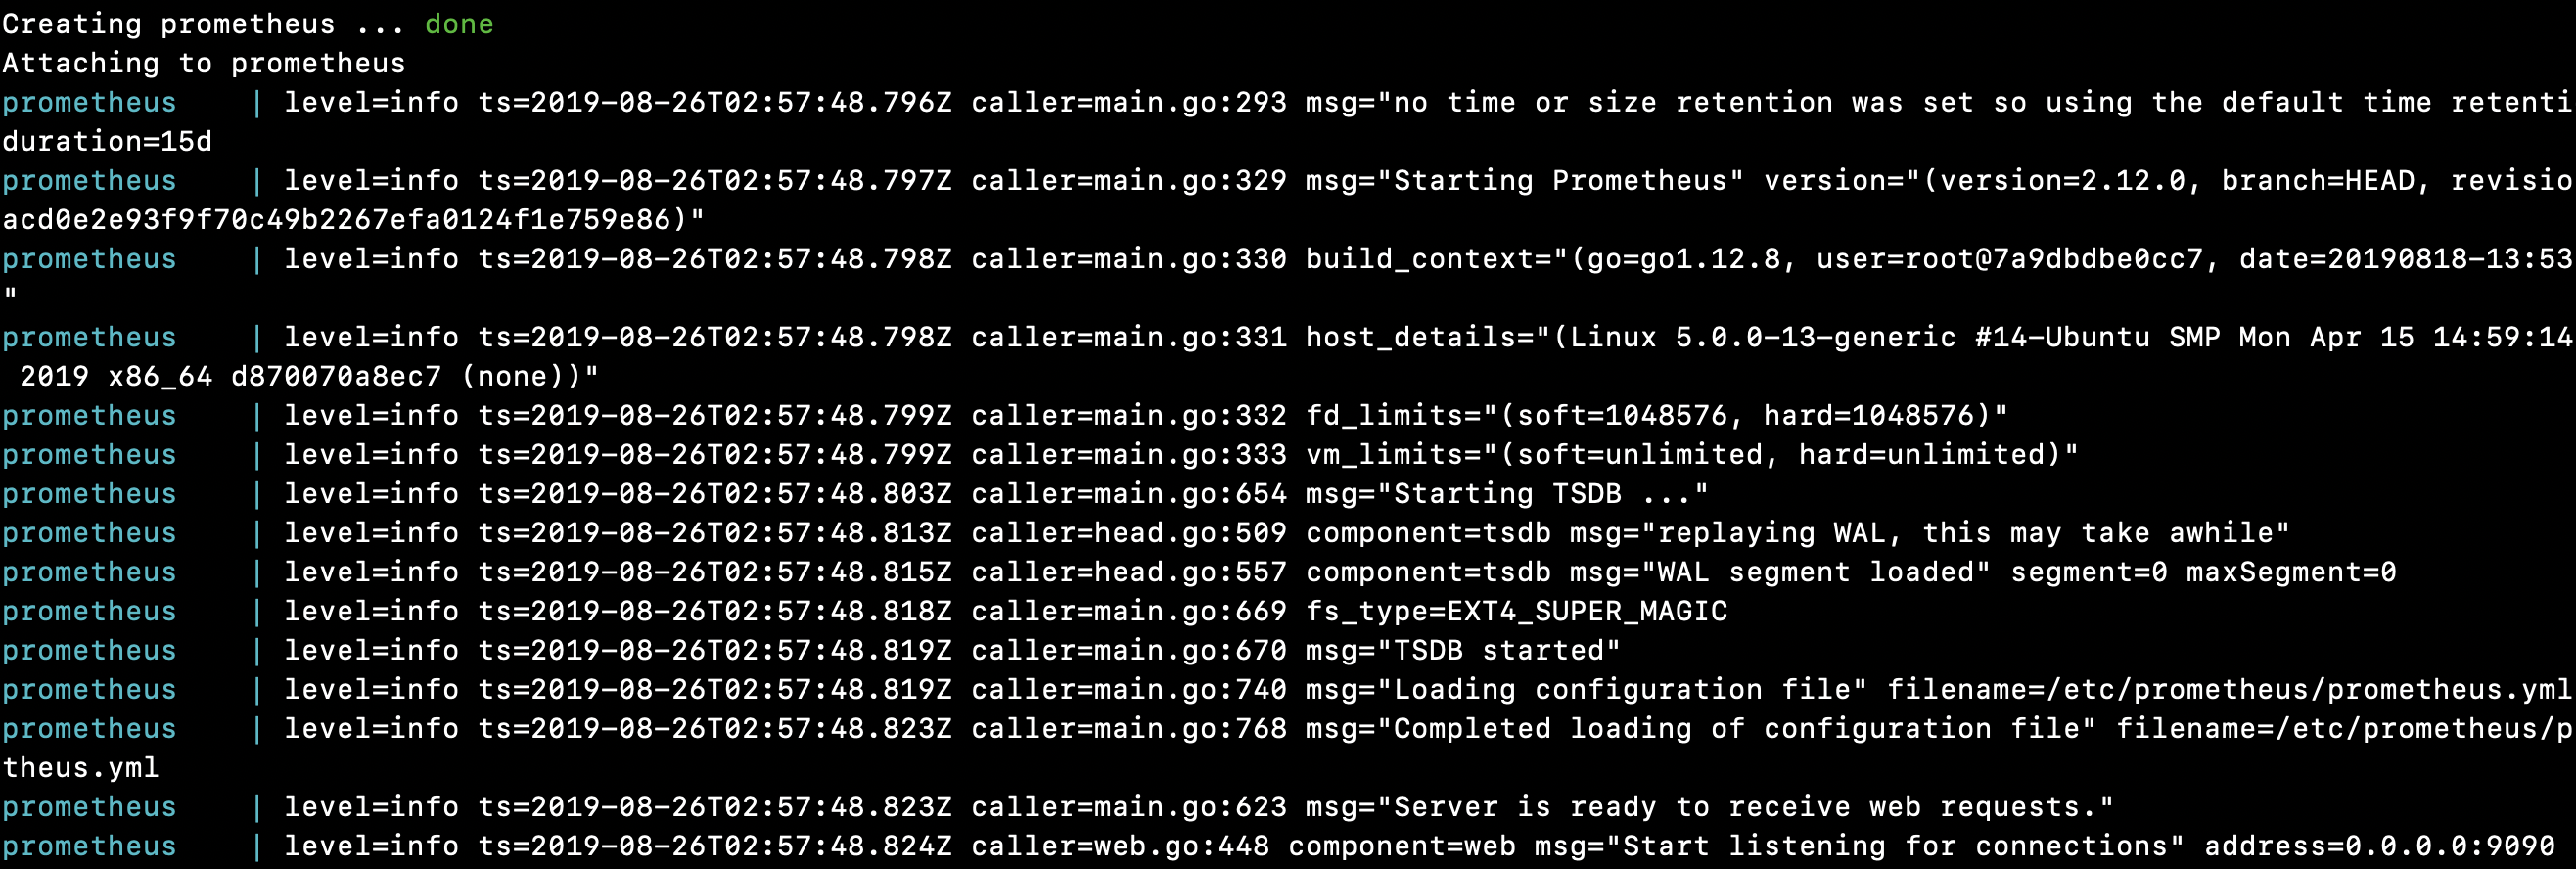
root @ localhost : / crunchify / prometheus # sudo systemctl start prometheus Creating network "prometheus_default" with the default driver Pulling prometheus ( prom / prometheus : latest ) . . . latest : Pulling from prom / prometheus 8e674ad76dce : Pull complete e77d2419d1c2 : Pull complete d7c0a2a2ca7e : Pull complete bd46de67c79d : Pull complete 35f6078df7e9 : Pull complete 8b3f04e26151 : Pull complete 9d234d9c8a77 : Pull complete 1a8a2a4f314d : Pull complete 62e28fd716ec : Pull complete Digest : sha256 : cd93b8711bb92eb9c437d74217311519e0a93bc55779aa664325dc83cd13cb32 Status : Downloaded newer image for prom / prometheus : latest Creating prometheus . . . done Attaching to prometheus prometheus | level = info ts = 2019 - 08 - 26T02 : 57 : 48.796Z caller = main . go : 293 msg = "no time or size retention was set so using the default time retention" duration = 15d prometheus | level = info ts = 2019 - 08 - 26T02 : 57 : 48.797Z caller = main . go : 329 msg = "Starting Prometheus" version = "(version=2.12.0, branch=HEAD, revision=43acd0e2e93f9f70c49b2267efa0124f1e759e86)" prometheus | level = info ts = 2019 - 08 - 26T02 : 57 : 48.798Z caller = main . go : 330 build_context = "(go=go1.12.8, user=root@7a9dbdbe0cc7, date=20190818-13:53:16)" prometheus | level = info ts = 2019 - 08 - 26T02 : 57 : 48.798Z caller = main . go : 331 host_details = "(Linux 5.0.0-13-generic #14-Ubuntu SMP Mon Apr 15 14:59:14 UTC 2019 x86_64 d870070a8ec7 (none))" prometheus | level = info ts = 2019 - 08 - 26T02 : 57 : 48.799Z caller = main . go : 332 fd_limits = "(soft=1048576, hard=1048576)" prometheus | level = info ts = 2019 - 08 - 26T02 : 57 : 48.799Z caller = main . go : 333 vm_limits = "(soft=unlimited, hard=unlimited)" prometheus | level = info ts = 2019 - 08 - 26T02 : 57 : 48.803Z caller = main . go : 654 msg = "Starting TSDB ..." prometheus | level = info ts = 2019 - 08 - 26T02 : 57 : 48.813Z caller = head . go : 509 component = tsdb msg = "replaying WAL, this may take awhile" prometheus | level = info ts = 2019 - 08 - 26T02 : 57 : 48.815Z caller = head . go : 557 component = tsdb msg = "WAL segment loaded" segment = 0 maxSegment = 0 prometheus | level = info ts = 2019 - 08 - 26T02 : 57 : 48.818Z caller = main . go : 669 fs_type = EXT4_SUPER_MAGIC prometheus | level = info ts = 2019 - 08 - 26T02 : 57 : 48.819Z caller = main . go : 670 msg = "TSDB started" prometheus | level = info ts = 2019 - 08 - 26T02 : 57 : 48.819Z caller = main . go : 740 msg = "Loading configuration file" filename =/ etc / prometheus / prometheus . yml prometheus | level = info ts = 2019 - 08 - 26T02 : 57 : 48.823Z caller = main . go : 768 msg = "Completed loading of configuration file" filename =/ etc / prometheus / prometheus . yml prometheus | level = info ts = 2019 - 08 - 26T02 : 57 : 48.823Z caller = main . go : 623 msg = "Server is ready to receive web requests." prometheus | level = info ts = 2019 - 08 - 26T02 : 57 : 48.824Z caller = web . go : 448 component = web msg = "Start listening for connections" address = 0.0.0.0 : 9090 |
恭喜!! 您已在主机上成功启动 Prometheus。
让我们玩一下 Prometheus Dashboard 和 UI
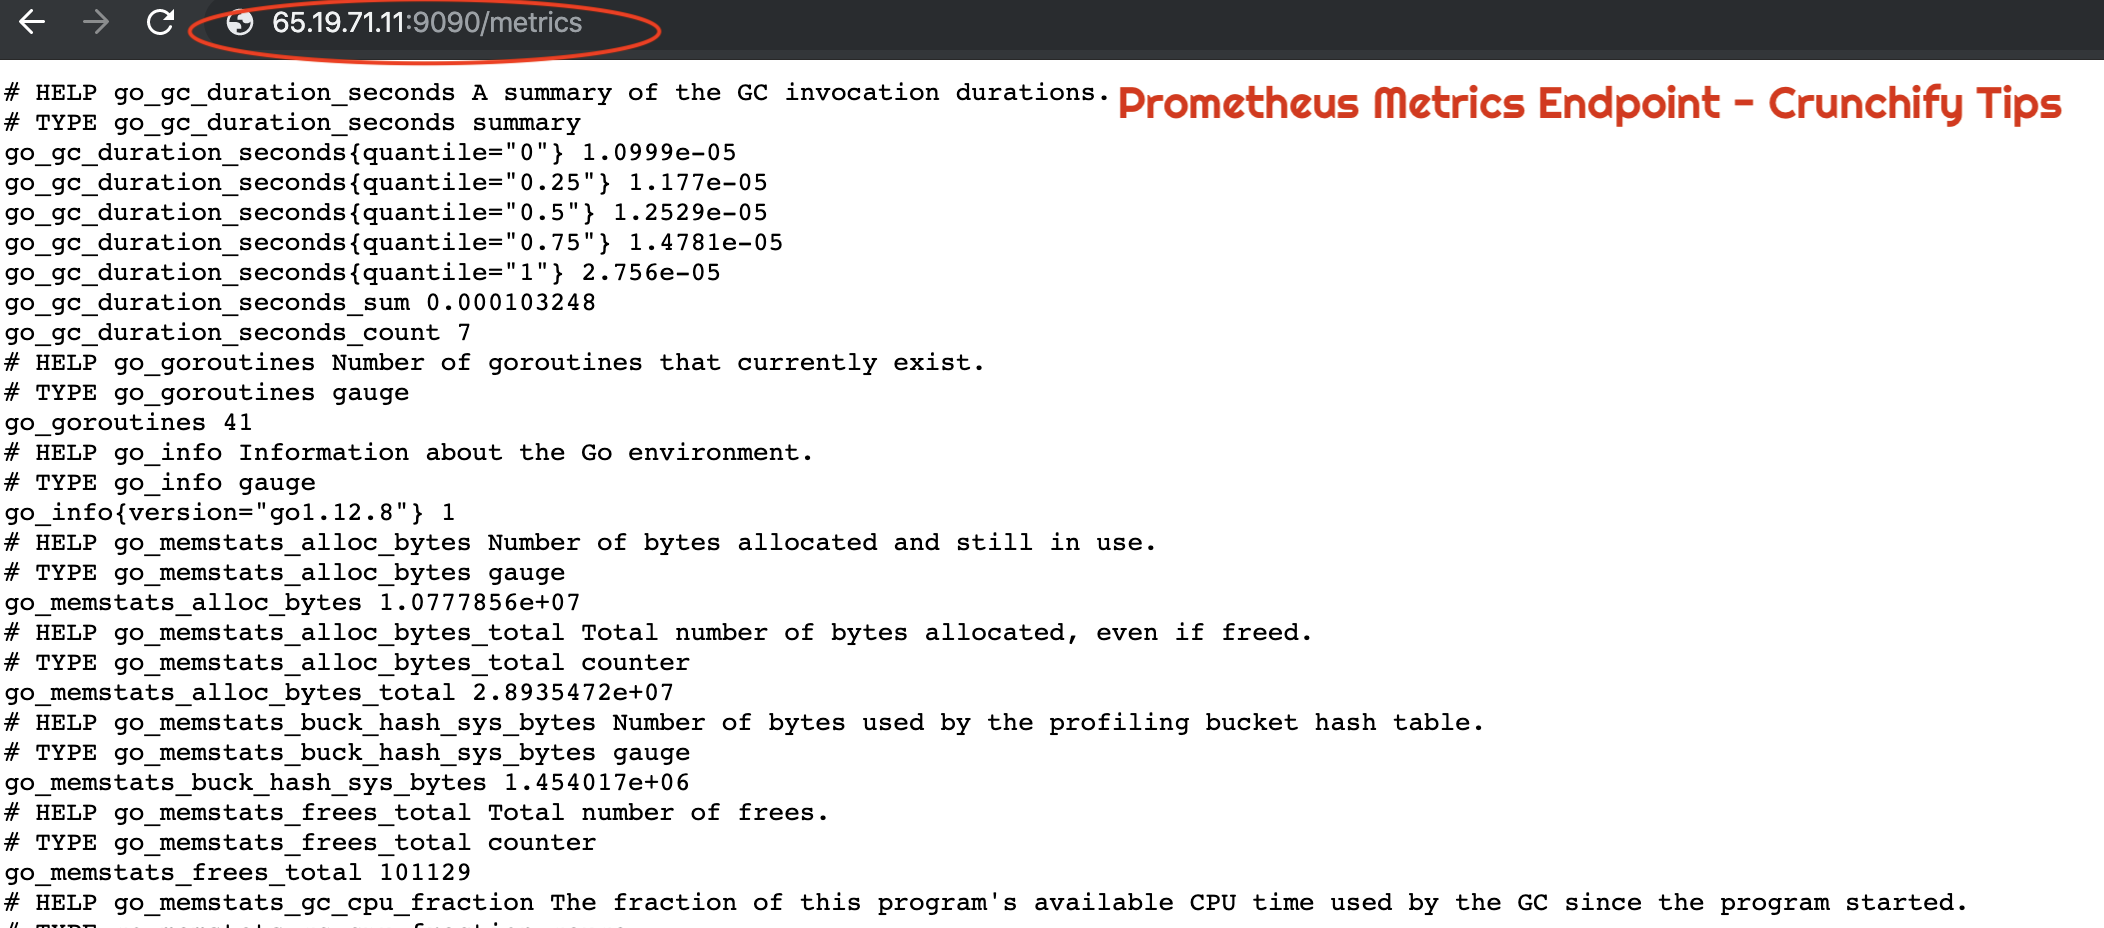
如何验证 Prometheus 是否正常运行?
|
1 |
URL : http : //65.19.71.11:9090/metrics |
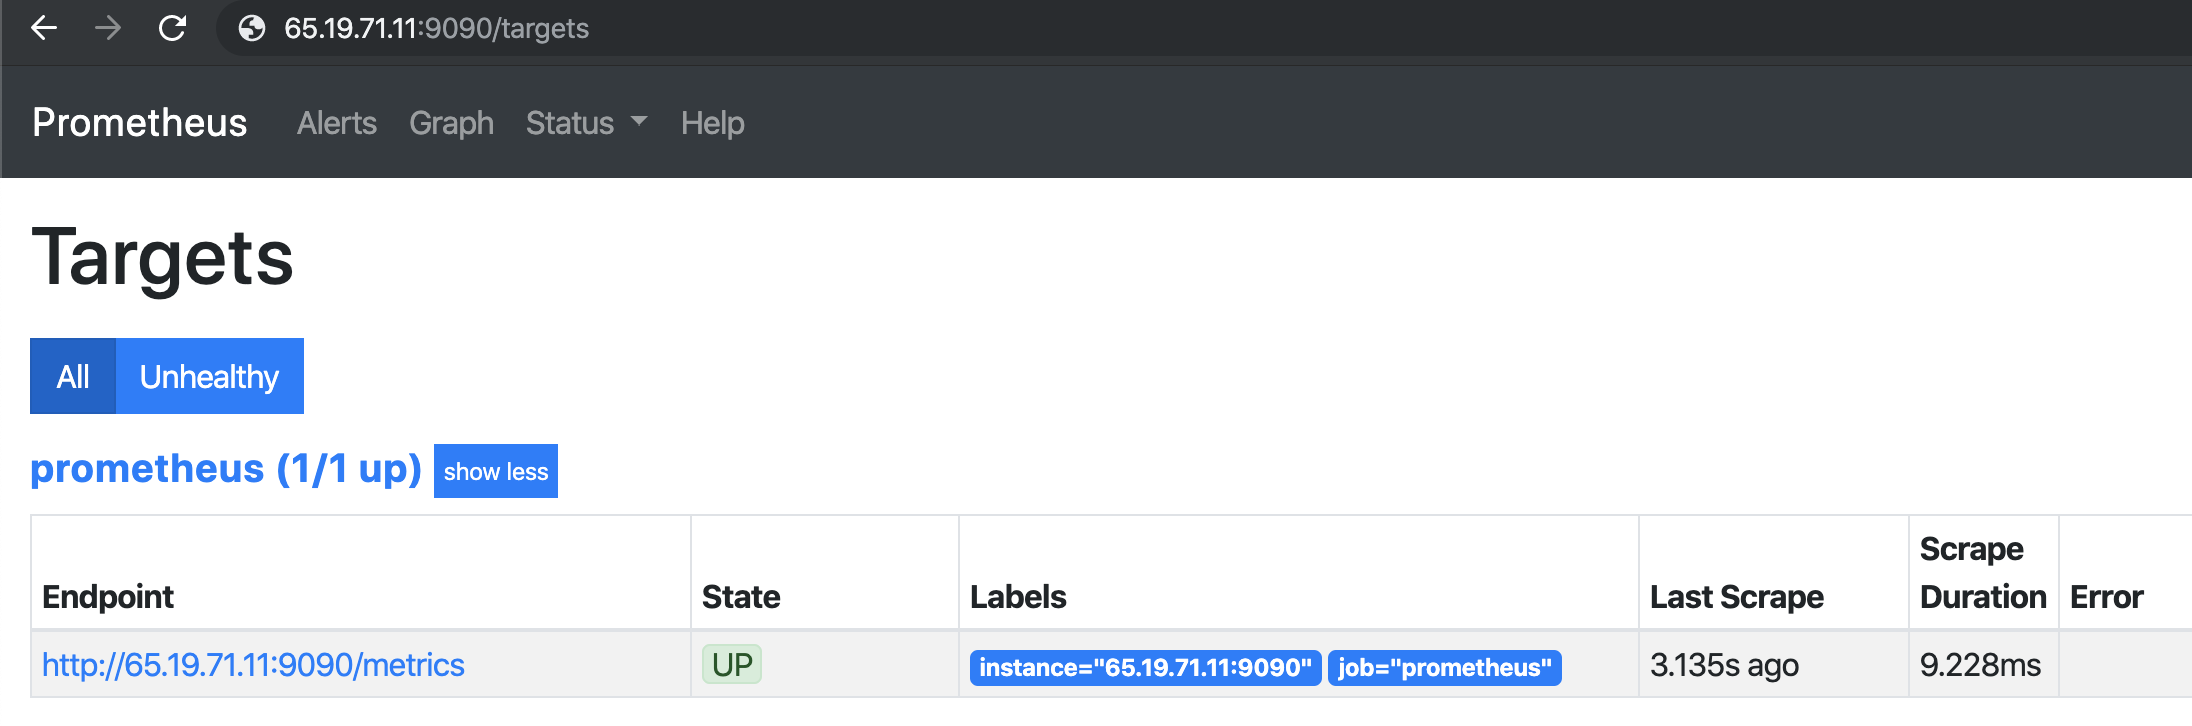
如何使用 Prometheus 验证主机或虚拟机的 UP 状态?
|
1 |
URL : http : //65.19.71.11:9090/targets |
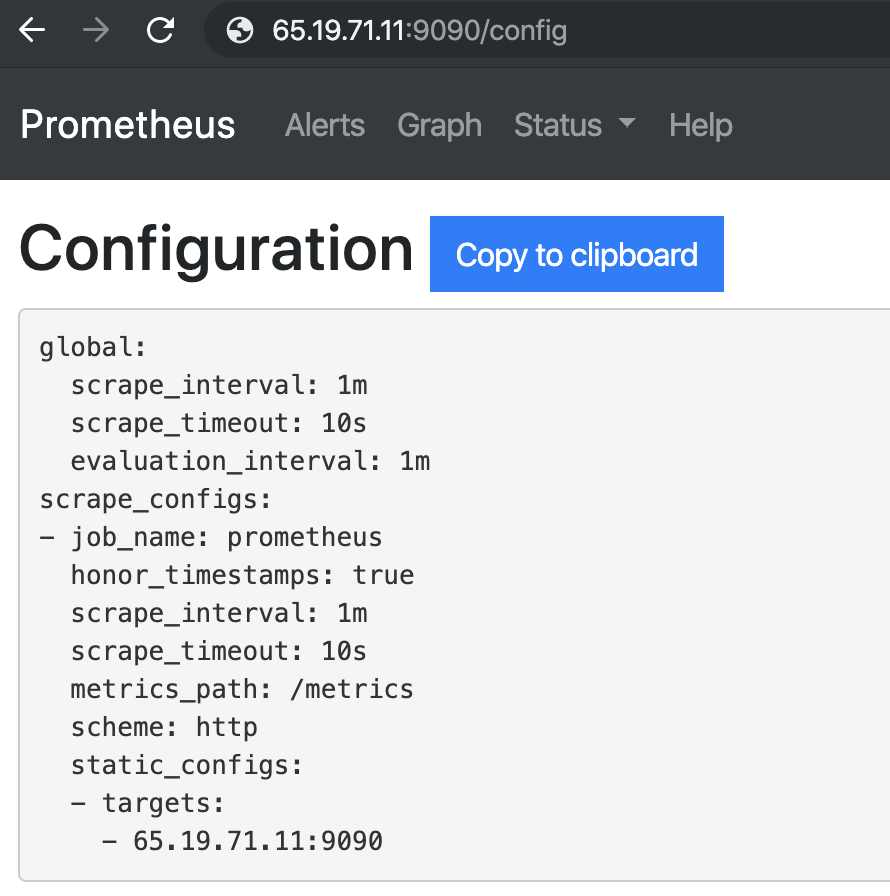
如何在浏览器上查看 Prometheus 配置?
Prometheus 运行时信息
|
1 |
URL : http : //65.19.71.11:9090/status |
| 正常运行时间 | 2019-08-26 03:07:24.244852166 +0000 UTC |
|---|---|
| 工作目录 | /普罗米修斯 |
| 配置重新加载 | 成功的 |
| 上次成功的配置重新加载 | 2019-08-26 03:07:24 +0000 UTC |
| 头块 | 533 |
| 头部时间序列 | 533 |
| WAL 腐败 | 0 |
| 协程 | 36 |
| GOMAXPROCS | 1 |
| GOGC | |
| 神虫 | |
| 存储保留 | 15天 |
普罗米修斯构建信息
| 版本 | 2.12.0 |
|---|---|
| 修订 | 43acd0e2e93f9f70c49b2267efa0124f1e759e86 |
| 分支 | 头 |
| 构建用户 | 根@7a9dbdbe0cc7 |
| 建造日期 | 20190818-13:53:16 |
| 版本 | 去1.12.8 |
Prometheus 命令行标志:
|
1 |
URL : http : //65.19.71.11:9090/flags |
| alertmanager.notification-queue-容量 | 10000 |
|---|---|
| alertmanager.timeout | 10s |
| 配置文件 | /etc/prometheus/prometheus.yml |
| 日志格式 | 日志文件 |
| 日志级别 | 信息 |
| query.lookback-delta | 5m |
| query.max-并发 | 20 |
| query.max-samples | 50000000 |
| 查询超时 | 2m |
| rules.alert.for-grace-period | 10m |
| rules.alert.for-outage-tolerance | 1小时 |
| rules.alert.resend-delay | 1m |
| storage.remote.flush-deadline | 1m |
| storage.remote.read-concurrent-limit | 10 |
| storage.remote.read-sample-limit | 50000000 |
| storage.tsdb.allow-overlapping-blocks | 错误的 |
| storage.tsdb.max-block-duration | 36小时 |
| storage.tsdb.min-block-duration | 2小时 |
| storage.tsdb.no-lockfile | 错误的 |
| storage.tsdb.path | /普罗米修斯 |
| storage.tsdb.retention | 0s |
| storage.tsdb.retention.size | 0B |
| storage.tsdb.retention.time | 0s |
| storage.tsdb.wal-压缩 | 错误的 |
| storage.tsdb.wal 段大小 | 0B |
| web.console.libraries | 控制台库 |
| web.console.templates | 控制台 |
| web.cors.origin | .* |
| web.enable-admin-api | 错误的 |
| web.enable-生命周期 | 错误的 |
| web.external-url | |
| web.listen-address | 0.0.0.0:9090 |
| web.max-连接 | 512 |
| web.page-title | Prometheus 时序采集和处理服务器 |
| web.read-timeout | 5m |
| web.route-前缀 | / |
你都准备好了。 您已successfully installed Prometheus并验证了它的所有功能。