
Linux'ta Prometheus Nasıl Kurulur ve Yapılandırılır? (Ubuntu ve CentOS)
Yayınlanan: 2019-08-26
Prometheus nedir?
Prometheus birinci sınıf bir İzleme Sistemidir, varsayılan olarak Zaman Serisi Veritabanı ile birlikte gelir. Aslen 2012 yılında inşa edilmiş bir açık kaynaklı sistemdir.
Dünyanın en büyük 500 şirketi, altyapıları ve uygulamaları için ölçümler toplamak için Prometheus'u kullanıyor. Prometheus, esas olarak Metrik olarak tanımlanan zaman serisi verileriyle çok boyutlu veri modelini destekler.
Prometheus kendi kurulumunun Time Series DB (TSDB) kısmını kullandığı için özel bir veri depolama gereksinimi yoktur.
Bu derste Prometheus'u süper basit adımlarla Linux Ubuntu ve CentOS'a kuracağız.
Başlayalım:
Adım-1 Linux işletim sistemi sürümünü doğrulayın
Komut: cat /etc/os-release
|
1 2 3 4 5 6 7 8 9 10 11 12 13 |
root @ localhost : ~ # cat /etc/os-release NAME = "Ubuntu" VERSION = "19.04 (Disco Dingo)" ID = ubuntu ID_LIKE = debian PRETTY_NAME = "Ubuntu 19.04" VERSION_ID = "19.04" HOME_URL = "https://www.ubuntu.com/" SUPPORT_URL = "https://help.ubuntu.com/" BUG_REPORT_URL = "https://bugs.launchpad.net/ubuntu/" PRIVACY_POLICY_URL = "https://www.ubuntu.com/legal/terms-and-policies/privacy-policy" VERSION_CODENAME = disco UBUNTU_CODENAME = disco |
Aşağıdaki adımlar Ubuntu Linux OS için geçerlidir.
Adım-2 Prometheus Verileri ve Yapılandırma Klasörü Oluşturun
Komutlar :
|
1 2 3 |
root @ localhost : ~ # sudo mkdir /crunchify/prometheus/conf root @ localhost : ~ # sudo mkdir /crunchify/prometheus/data |
Her iki klasörü de doğrulayalım:
|
1 2 3 4 5 6 7 8 9 |
root @ localhost : / crunchify / prometheus # pwd / crunchify / prometheus root @ localhost : / crunchify / prometheus # ls -ltra total 16 drwxr - xr - x 2 root root 4096 Aug 25 23 : 37 conf drwxr - xr - x 3 root root 4096 Aug 25 23 : 37 . . drwxr - xr - x 2 root root 4096 Aug 25 23 : 37 data drwxr - xr - x 4 root root 4096 Aug 25 23 : 37 . |
Adım-3 Veri klasörünün sahipliğini değiştirin
Bu, sonraki adımlarda izin sorununu önlemek için gereklidir.
|
1 |
root @ localhost : / crunchify / prometheus # sudo chown 65534:65534 /crunchify/prometheus/data/ |
Adım-4 prometheus.yml dosyası oluşturun
/crunchify/prometheus/conf klasörüne gidin ve prometheus.yml dosyasını oluşturun.
|
1 2 3 |
root @ localhost : / # cd /crunchify/prometheus/conf root @ localhost : / crunchify / prometheus / conf # vi prometheus.yml |
prometheus.yml dosya içeriği:
|
1 2 3 4 5 6 7 8 9 10 11 12 13 14 15 16 17 18 19 20 21 22 23 24 25 26 27 28 29 |
# my global config global : scrape_interval : 15s # Set the scrape interval to every 15 seconds. Default is every 1 minute. evaluation_interval : 15s # Evaluate rules every 15 seconds. The default is every 1 minute. # scrape_timeout is set to the global default (10s). # Alertmanager configuration alerting : alertmanagers : - static_configs : - targets : # - alertmanager:9093 # Load rules once and periodically evaluate them according to the global 'evaluation_interval'. rule_files : # - "first_rules.yml" # - "second_rules.yml" # A scrape configuration containing exactly one endpoint to scrape: # Here it's Prometheus itself. scrape_configs : # The job name is added as a label `job=<job_name>` to any time series scraped from this config. - job_name : 'prometheus' # metrics_path defaults to '/metrics' # scheme defaults to 'http'. static_configs : - targets : [ '65.19.71.11:9090' ] |
Note: Yukarıdaki dosyada - IP'yi ana bilgisayar/VM IP'nizle değiştirin.
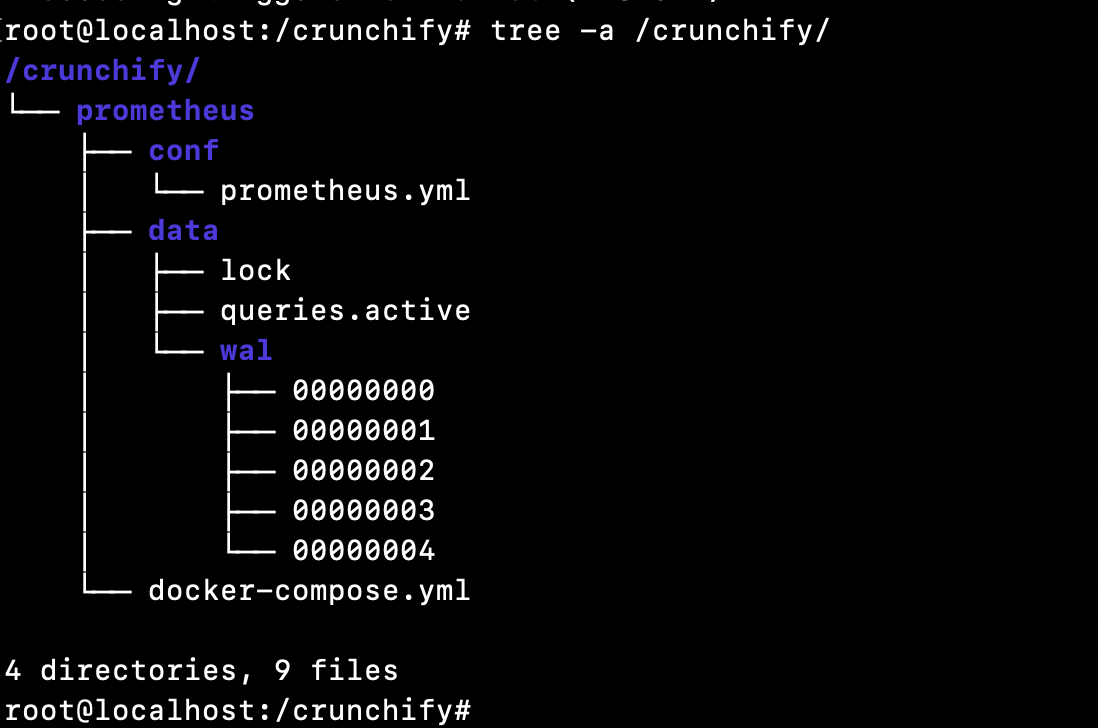
İşte bu eğitim için bir Directory structure :
Adım-5 Sanal makinenize Docker yüklediğinizden emin olun.
Docker'ın kurulu olup olmadığı nasıl kontrol edilir?
|
1 2 3 |
root @ localhost : ~ # docker Command 'docker' not found |
Bu, ana makinenize/VM'nize docker kurulu olmadığı anlamına gelir. Docker'ı ana makinenize/VM'nize kurmak için lütfen Docker kurulum eğitimini tamamen takip edin.
6. Adım Docker Compose'u kurun
Pre-requisite, aşağıdaki adımları uygulamadan önce Docker'ı kurmaktır. (Adım 5)
Aşağıdaki üç komutu yürütün:
|
1 2 3 4 5 6 7 8 9 |
root @ localhost : ~ # sudo curl -L "https://github.com/docker/compose/releases/download/1.24.1/docker-compose-$(uname -s)-$(uname -m)" -o /usr/local/bin/docker-compose % Total % Received % Xferd Average Speed Time Time Time Current Dload Upload Total Spent Left Speed 100 617 0 617 0 0 2448 0 -- : -- : -- -- : -- : -- -- : -- : -- 2448 100 15.4M 100 15.4M 0 0 11.2M 0 0 : 00 : 01 0 : 00 : 01 -- : -- : -- 15.7M root @ localhost : ~ # sudo chmod +x /usr/local/bin/docker-compose root @ localhost : ~ # sudo ln -s /usr/local/bin/docker-compose /usr/bin/docker-compose |
Adım-7 Docker Oluşturma Sürümünü Doğrulayın
|
1 2 3 |
root @ localhost : ~ # docker-compose --version docker - compose version 1.24.1 , build 4667896b |
Tebrikler – liman işçisi oluşturma sanal makinenize başarıyla yüklendi.
Adım-8 docker-compose.yml dosyası oluşturun
/crunchify/prometheus klasörüne gidin.
|
1 2 3 |
root @ localhost : / crunchify # cd /crunchify/prometheus/ root @ localhost : / crunchify / prometheus # vi docker-compose.yml |
docker-compose.yml dosya içeriği:
|
1 2 3 4 5 6 7 8 9 10 11 12 13 14 |
version : "3" services : prometheus : image : prom / prometheus : latest container_name : prometheus volumes : - / crunchify / prometheus / conf : / etc / prometheus - / crunchify / prometheus / data : / prometheus command : - '--config.file=/etc/prometheus/prometheus.yml' - '--storage.tsdb.path=/prometheus' ports : - "9090:9090" |
Adım-9 Prometheus Başlat/Durdur'u sistem kontrolünün bir parçası olarak kurun.
vi /etc/systemd/system/prometheus.service dosyasını oluşturun
prometheus.service dosya içeriği:
|
1 2 3 4 5 6 7 8 9 10 11 12 13 14 15 16 17 |
[ Unit ] Description = Prometheus monitoring docker container After = docker . service BindsTo = docker . service [ Service ] Restart = always WorkingDirectory =/ crunchify / prometheus / # Ubuntu ExecStart =/ usr / bin / docker - compose up ExecStop =/ usr / bin / docker - compose down # CentOS #ExecStart=/usr/bin/docker-compose up #ExecStop=/usr/bin/docker-compose down [ Install ] WantedBy = multi - user . target |

Adım-10 Prometheus hizmetini başlatın
|
1 2 3 4 5 6 |
root @ localhost : / crunchify / prometheus / config # sudo systemctl daemon-reload root @ localhost : / crunchify / prometheus / config # sudo systemctl enable prometheus Created symlink / etc / systemd / system / multi - user . target . wants / prometheus . service → / etc / systemd / system / prometheus . service . root @ localhost : / crunchify / prometheus / config # sudo systemctl start prometheus |
Prometheus Sunucusu Linux'ta Başlatıldı:
|
1 2 3 4 5 6 7 8 9 10 11 12 13 14 15 16 17 18 19 20 21 22 23 24 25 26 27 28 29 30 31 32 |
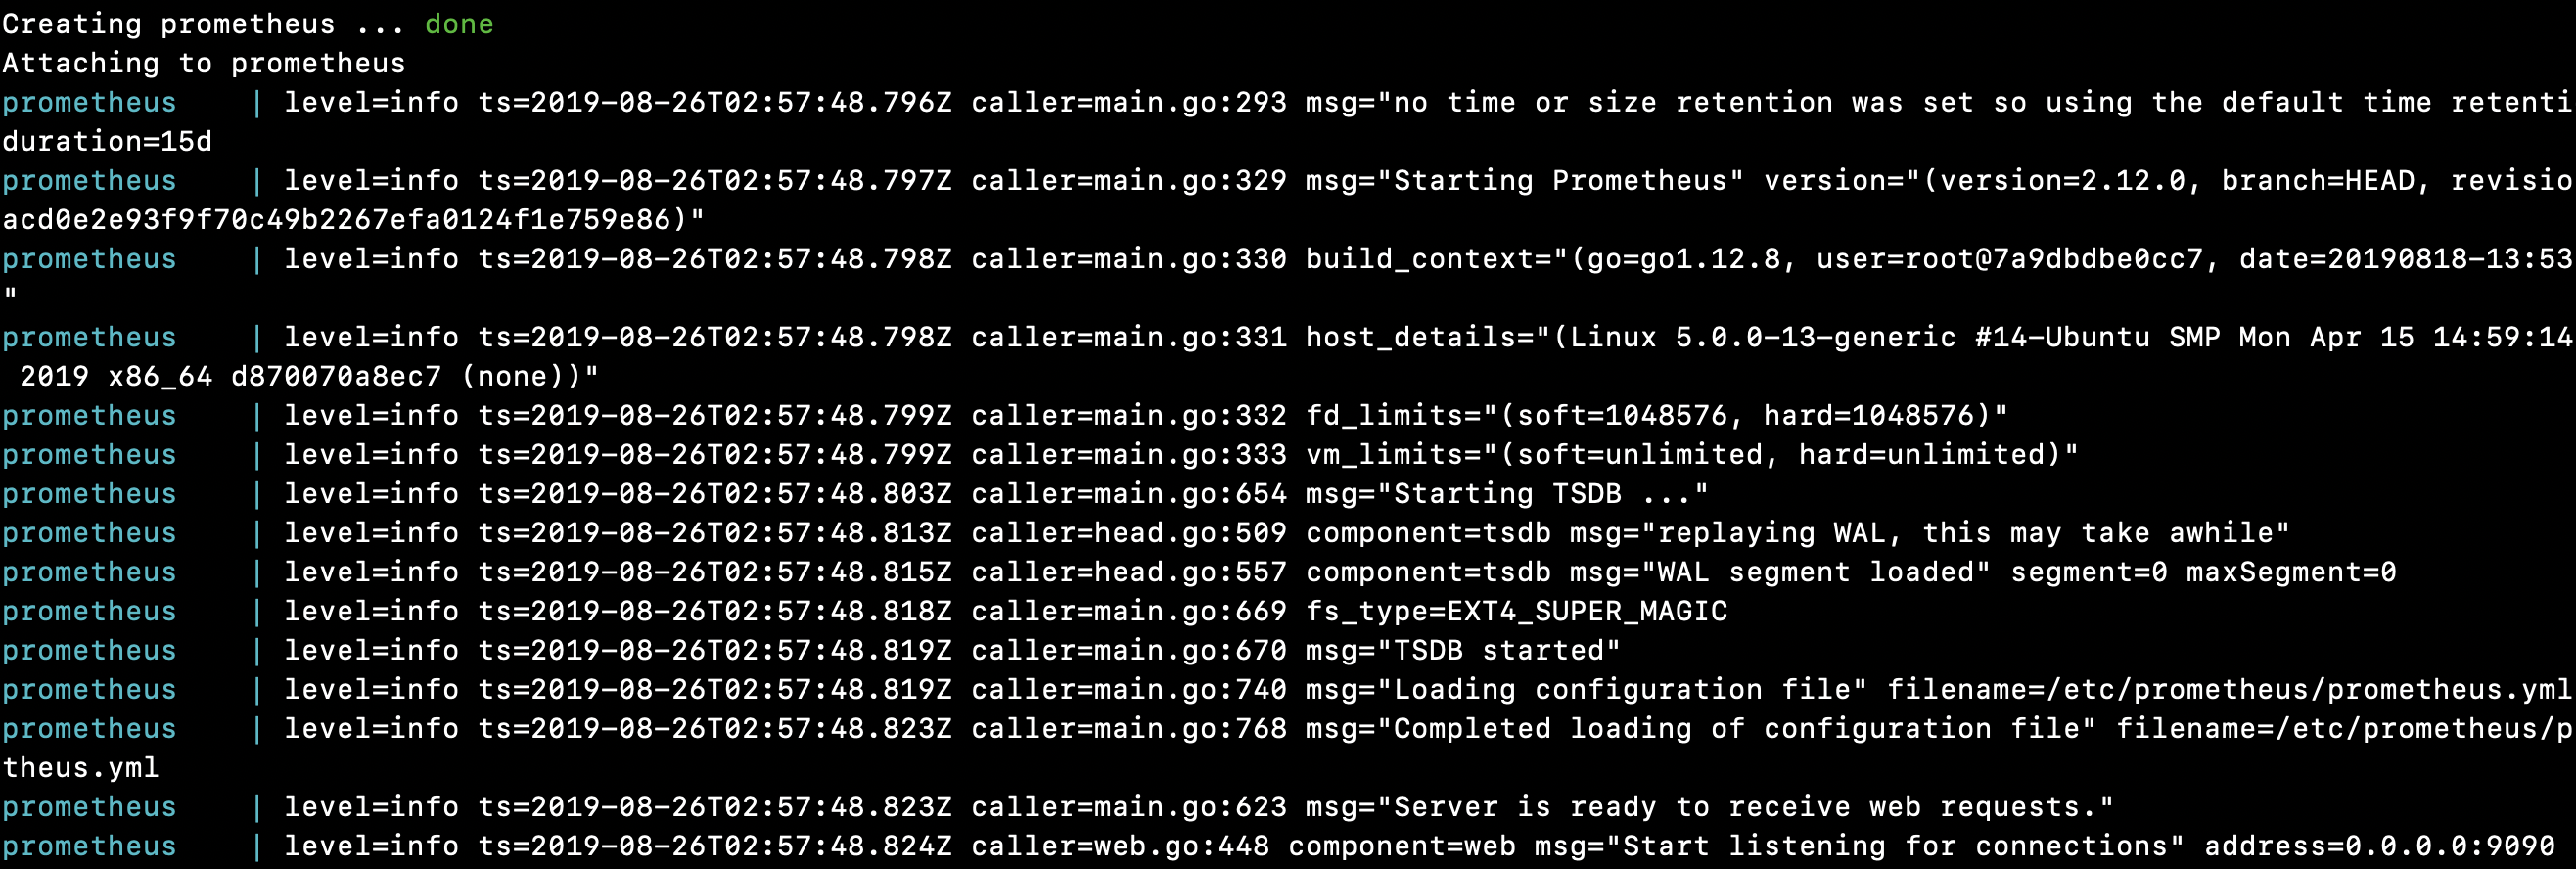
root @ localhost : / crunchify / prometheus # sudo systemctl start prometheus Creating network "prometheus_default" with the default driver Pulling prometheus ( prom / prometheus : latest ) . . . latest : Pulling from prom / prometheus 8e674ad76dce : Pull complete e77d2419d1c2 : Pull complete d7c0a2a2ca7e : Pull complete bd46de67c79d : Pull complete 35f6078df7e9 : Pull complete 8b3f04e26151 : Pull complete 9d234d9c8a77 : Pull complete 1a8a2a4f314d : Pull complete 62e28fd716ec : Pull complete Digest : sha256 : cd93b8711bb92eb9c437d74217311519e0a93bc55779aa664325dc83cd13cb32 Status : Downloaded newer image for prom / prometheus : latest Creating prometheus . . . done Attaching to prometheus prometheus | level = info ts = 2019 - 08 - 26T02 : 57 : 48.796Z caller = main . go : 293 msg = "no time or size retention was set so using the default time retention" duration = 15d prometheus | level = info ts = 2019 - 08 - 26T02 : 57 : 48.797Z caller = main . go : 329 msg = "Starting Prometheus" version = "(version=2.12.0, branch=HEAD, revision=43acd0e2e93f9f70c49b2267efa0124f1e759e86)" prometheus | level = info ts = 2019 - 08 - 26T02 : 57 : 48.798Z caller = main . go : 330 build_context = "(go=go1.12.8, user=root@7a9dbdbe0cc7, date=20190818-13:53:16)" prometheus | level = info ts = 2019 - 08 - 26T02 : 57 : 48.798Z caller = main . go : 331 host_details = "(Linux 5.0.0-13-generic #14-Ubuntu SMP Mon Apr 15 14:59:14 UTC 2019 x86_64 d870070a8ec7 (none))" prometheus | level = info ts = 2019 - 08 - 26T02 : 57 : 48.799Z caller = main . go : 332 fd_limits = "(soft=1048576, hard=1048576)" prometheus | level = info ts = 2019 - 08 - 26T02 : 57 : 48.799Z caller = main . go : 333 vm_limits = "(soft=unlimited, hard=unlimited)" prometheus | level = info ts = 2019 - 08 - 26T02 : 57 : 48.803Z caller = main . go : 654 msg = "Starting TSDB ..." prometheus | level = info ts = 2019 - 08 - 26T02 : 57 : 48.813Z caller = head . go : 509 component = tsdb msg = "replaying WAL, this may take awhile" prometheus | level = info ts = 2019 - 08 - 26T02 : 57 : 48.815Z caller = head . go : 557 component = tsdb msg = "WAL segment loaded" segment = 0 maxSegment = 0 prometheus | level = info ts = 2019 - 08 - 26T02 : 57 : 48.818Z caller = main . go : 669 fs_type = EXT4_SUPER_MAGIC prometheus | level = info ts = 2019 - 08 - 26T02 : 57 : 48.819Z caller = main . go : 670 msg = "TSDB started" prometheus | level = info ts = 2019 - 08 - 26T02 : 57 : 48.819Z caller = main . go : 740 msg = "Loading configuration file" filename =/ etc / prometheus / prometheus . yml prometheus | level = info ts = 2019 - 08 - 26T02 : 57 : 48.823Z caller = main . go : 768 msg = "Completed loading of configuration file" filename =/ etc / prometheus / prometheus . yml prometheus | level = info ts = 2019 - 08 - 26T02 : 57 : 48.823Z caller = main . go : 623 msg = "Server is ready to receive web requests." prometheus | level = info ts = 2019 - 08 - 26T02 : 57 : 48.824Z caller = web . go : 448 component = web msg = "Start listening for connections" address = 0.0.0.0 : 9090 |
Tebrikler!! Host cihazınızda Prometheus'u başarıyla başlattınız.
Prometheus Dashboard ve UI ile oynayalım
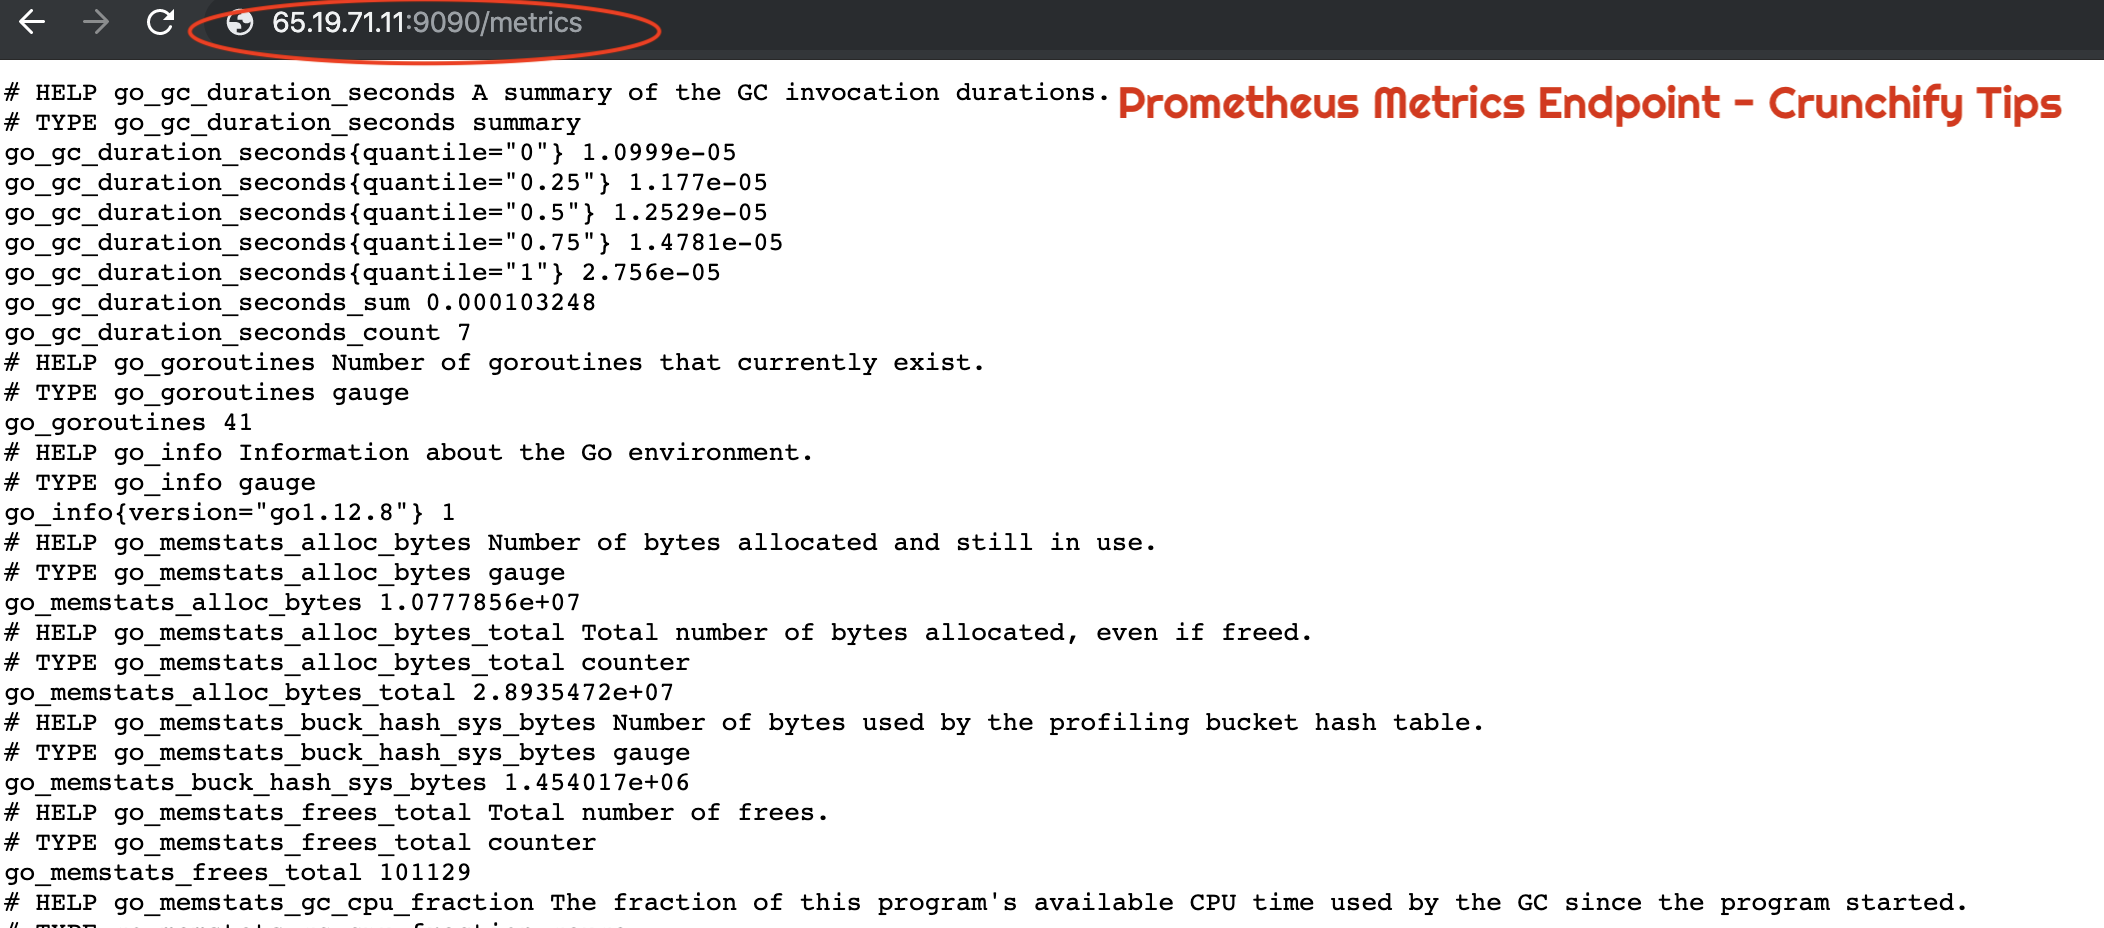
Prometheus'un düzgün çalışıp çalışmadığı nasıl doğrulanır?
|
1 |
URL : http : //65.19.71.11:9090/metrics |
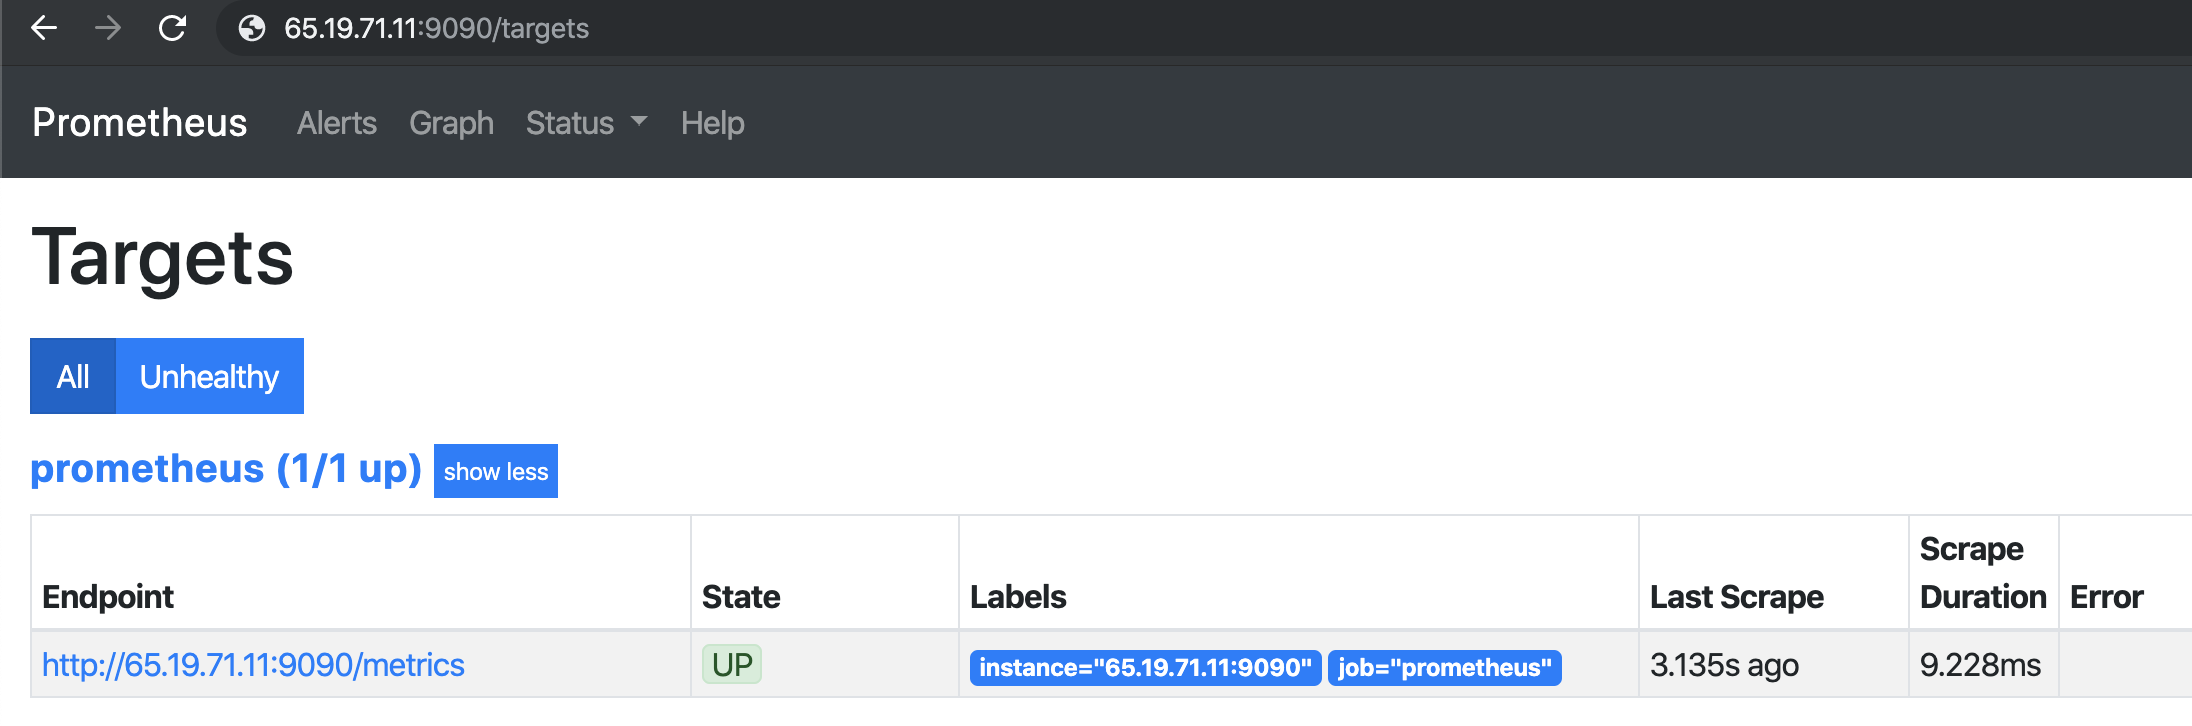
Prometheus kullanarak Host veya VM'nin UP durumu nasıl doğrulanır?
|
1 |
URL : http : //65.19.71.11:9090/targets |
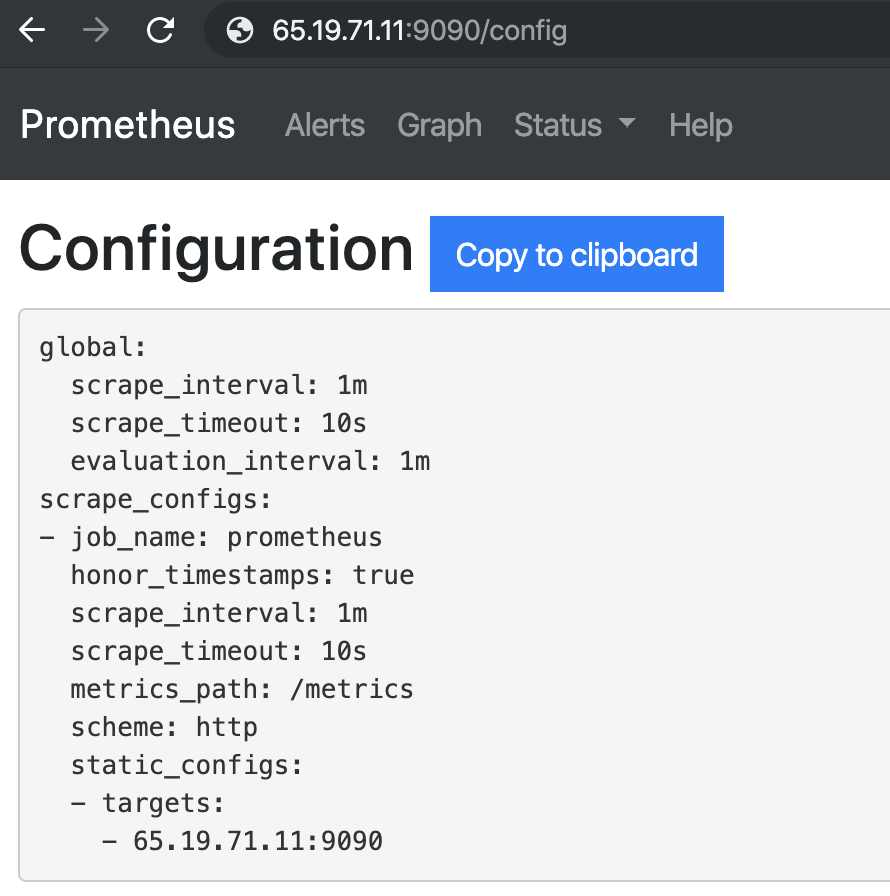
Tarayıcıda Prometheus Yapılandırması nasıl kontrol edilir?
Prometheus Çalışma Zamanı Bilgileri
|
1 |
URL : http : //65.19.71.11:9090/status |
| çalışma süresi | 2019-08-26 03:07:24.244852166 +0000 UTC |
|---|---|
| Çalışma dizini | /prometheus |
| Yapılandırma yeniden yükleme | Başarılı |
| Son başarılı yapılandırma yeniden yüklemesi | 2019-08-26 03:07:24 +0000 UTC |
| kafa parçaları | 533 |
| Baş zaman serisi | 533 |
| WAL bozulmaları | 0 |
| Goroutinler | 36 |
| GOMAXPROCS | 1 |
| GOGC | |
| GODEBUG | |
| Depolama Tutma | 15 gün |
Prometheus Yapı Bilgileri
| sürüm | 2.12.0 |
|---|---|
| Revizyon | 43acd0e2e93f9f70c49b2267efa0124f1e759e86 |
| Dal | KAFA |
| Yapı Kullanıcısı | root@7a9dbdbe0cc7 |
| Kuruluş zamanı | 20190818-13:53:16 |
| GoVersion | git1.12.8 |
Prometheus Komut Satırı Bayrakları:
|
1 |
URL : http : //65.19.71.11:9090/flags |
| alertmanager.notification-kuyruk-kapasitesi | 10000 |
|---|---|
| uyarı yöneticisi.zaman aşımı | 10'lar |
| yapılandırma dosyası | /etc/prometheus/prometheus.yml |
| log.format | logfmt |
| günlük.seviye | bilgi |
| sorgu.geriye bakma-delta | 5m |
| sorgu.max-eşzamanlılık | 20 |
| sorgu.max-örnekler | 50000000 |
| sorgu.zaman aşımı | 2m |
| kurallar.alert.for-grace-dönemi | 10m |
| kurallar.alert.for-outage-tolerance | 1 saat |
| kurallar.alert.yeniden gönderme-gecikme | 1m |
| depolama.remote.flush-son tarih | 1m |
| depolama.remote.read-concurrent-limit | 10 |
| depolama.remote.read-sample-limit | 50000000 |
| Storage.tsdb.allow-örtüşen bloklar | YANLIŞ |
| depolama.tsdb.max-blok süresi | 36h |
| depolama.tsdb.min-blok süresi | 2 saat |
| depolama.tsdb.no-kilit dosyası | YANLIŞ |
| depolama.tsdb.path | /prometheus |
| depolama.tsdb.saklama | 0'lar |
| depolama.tsdb.retention.size | 0B |
| depolama.tsdb.tutma.zaman | 0'lar |
| depolama.tsdb.wal-sıkıştırma | YANLIŞ |
| depolama.tsdb.wal-segment boyutu | 0B |
| web.console.libraries | konsol_kütüphaneleri |
| web.console.templates | konsollar |
| web.cors.orijin | .* |
| web.enable-admin-api | YANLIŞ |
| web.enable-yaşam döngüsü | YANLIŞ |
| web.harici-url | |
| web.listen-adresi | 0.0.0.0:9090 |
| web.max bağlantıları | 512 |
| web.sayfa başlığı | Prometheus Zaman Serisi Toplama ve İşleme Sunucusu |
| web.okuma zaman aşımı | 5m |
| web.route-ön eki | / |
Ve hepiniz hazırsınız. successfully installed Prometheus ve tüm özelliklerini doğruladınız.