
Bagaimana Cara Menginstal dan Mengonfigurasi Prometheus di Linux? (Ubuntu dan CentOS)
Diterbitkan: 2019-08-26
Apa itu Prometheus?
Prometheus adalah Sistem Pemantauan kelas dunia yang dilengkapi dengan Time Series Database sebagai default. Ini adalah sistem open-source yang awalnya dibangun pada tahun 2012.
500 perusahaan teratas dunia telah menggunakan Prometheus untuk mengumpulkan metrik untuk infrastruktur dan aplikasi mereka. Prometheus mendukung model data multi-dimensi dengan data deret waktu yang sebagian besar diidentifikasi sebagai Metrik.
Tidak ada persyaratan penyimpanan data khusus karena Prometheus menggunakan bagian Time Series DB (TSDB) dari instalasinya sendiri.
Dalam tutorial ini kita akan menginstal Prometheus di Linux Ubuntu dan CentOS dengan langkah super sederhana.
Mari kita mulai:
Langkah-1 Verifikasi versi OS Linux
Perintah: cat /etc/os-release
|
1 2 3 4 5 6 7 8 9 10 11 12 13 |
root @ localhost : ~ # cat /etc/os-release NAME = "Ubuntu" VERSION = "19.04 (Disco Dingo)" ID = ubuntu ID_LIKE = debian PRETTY_NAME = "Ubuntu 19.04" VERSION_ID = "19.04" HOME_URL = "https://www.ubuntu.com/" SUPPORT_URL = "https://help.ubuntu.com/" BUG_REPORT_URL = "https://bugs.launchpad.net/ubuntu/" PRIVACY_POLICY_URL = "https://www.ubuntu.com/legal/terms-and-policies/privacy-policy" VERSION_CODENAME = disco UBUNTU_CODENAME = disco |
Langkah-langkah di bawah ini berlaku untuk Ubuntu Linux OS .
Langkah-2 Buat Data Prometheus dan Folder Konfigurasi
Perintah :
|
1 2 3 |
root @ localhost : ~ # sudo mkdir /crunchify/prometheus/conf root @ localhost : ~ # sudo mkdir /crunchify/prometheus/data |
Mari kita verifikasi kedua folder:
|
1 2 3 4 5 6 7 8 9 |
root @ localhost : / crunchify / prometheus # pwd / crunchify / prometheus root @ localhost : / crunchify / prometheus # ls -ltra total 16 drwxr - xr - x 2 root root 4096 Aug 25 23 : 37 conf drwxr - xr - x 3 root root 4096 Aug 25 23 : 37 . . drwxr - xr - x 2 root root 4096 Aug 25 23 : 37 data drwxr - xr - x 4 root root 4096 Aug 25 23 : 37 . |
Langkah-3 Ubah kepemilikan folder Data
Ini diperlukan untuk menghindari masalah izin di langkah selanjutnya.
|
1 |
root @ localhost : / crunchify / prometheus # sudo chown 65534:65534 /crunchify/prometheus/data/ |
Langkah-4 Buat file prometheus.yml
Buka folder /crunchify/prometheus/conf dan buat file prometheus.yml .
|
1 2 3 |
root @ localhost : / # cd /crunchify/prometheus/conf root @ localhost : / crunchify / prometheus / conf # vi prometheus.yml |
konten file prometheus.yml:
|
1 2 3 4 5 6 7 8 9 10 11 12 13 14 15 16 17 18 19 20 21 22 23 24 25 26 27 28 29 |
# my global config global : scrape_interval : 15s # Set the scrape interval to every 15 seconds. Default is every 1 minute. evaluation_interval : 15s # Evaluate rules every 15 seconds. The default is every 1 minute. # scrape_timeout is set to the global default (10s). # Alertmanager configuration alerting : alertmanagers : - static_configs : - targets : # - alertmanager:9093 # Load rules once and periodically evaluate them according to the global 'evaluation_interval'. rule_files : # - "first_rules.yml" # - "second_rules.yml" # A scrape configuration containing exactly one endpoint to scrape: # Here it's Prometheus itself. scrape_configs : # The job name is added as a label `job=<job_name>` to any time series scraped from this config. - job_name : 'prometheus' # metrics_path defaults to '/metrics' # scheme defaults to 'http'. static_configs : - targets : [ '65.19.71.11:9090' ] |
Note: Pada file di atas – ganti IP dengan IP host/VM Anda.
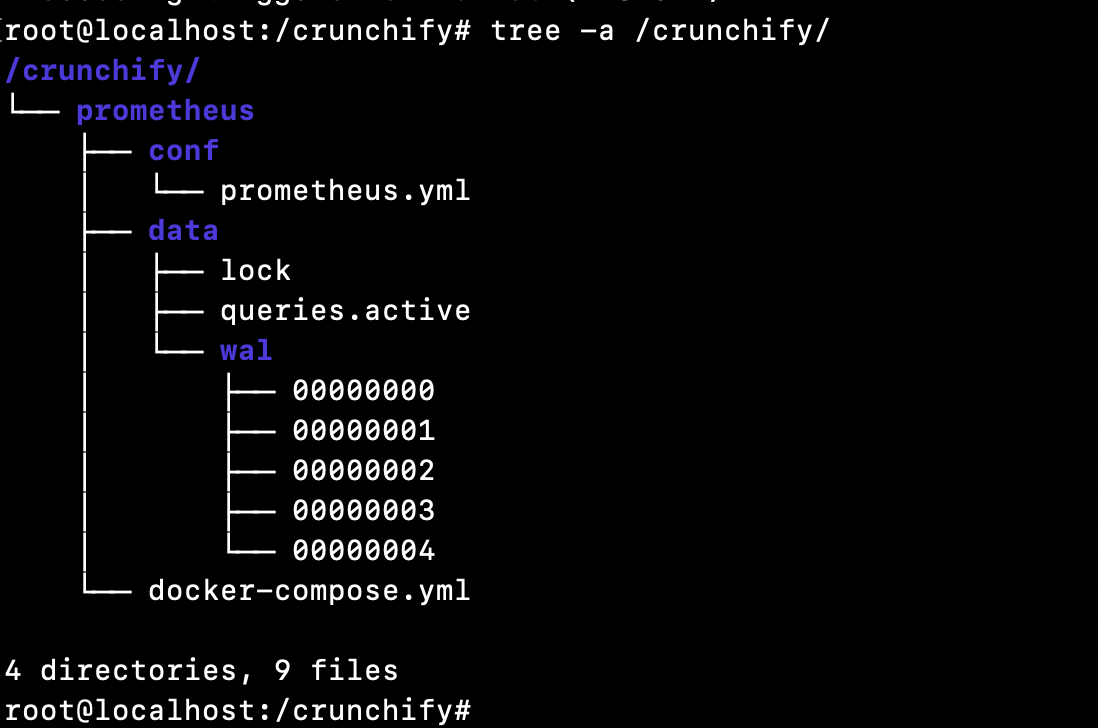
Berikut adalah Directory structure untuk tutorial ini:
Langkah-5 Pastikan Anda telah menginstal Docker di VM Anda.
Bagaimana cara memeriksa apakah Docker diinstal atau tidak?
|
1 2 3 |
root @ localhost : ~ # docker Command 'docker' not found |
Itu berarti buruh pelabuhan tidak diinstal pada Host/VM Anda. Silakan ikuti tutorial instalasi Docker sepenuhnya untuk menginstal Docker di Host/VM Anda.
Langkah-6 Instal Docker Compose
Pre-requisiteadalah menginstal Docker terlebih dahulu sebelum menjalankan langkah-langkah di bawah ini. (Langkah-5)
Jalankan tiga perintah di bawah ini:
|
1 2 3 4 5 6 7 8 9 |
root @ localhost : ~ # sudo curl -L "https://github.com/docker/compose/releases/download/1.24.1/docker-compose-$(uname -s)-$(uname -m)" -o /usr/local/bin/docker-compose % Total % Received % Xferd Average Speed Time Time Time Current Dload Upload Total Spent Left Speed 100 617 0 617 0 0 2448 0 -- : -- : -- -- : -- : -- -- : -- : -- 2448 100 15.4M 100 15.4M 0 0 11.2M 0 0 : 00 : 01 0 : 00 : 01 -- : -- : -- 15.7M root @ localhost : ~ # sudo chmod +x /usr/local/bin/docker-compose root @ localhost : ~ # sudo ln -s /usr/local/bin/docker-compose /usr/bin/docker-compose |
Langkah-7 Verifikasi Versi Tulis Docker
|
1 2 3 |
root @ localhost : ~ # docker-compose --version docker - compose version 1.24.1 , build 4667896b |
Selamat – docker compose berhasil diinstal pada VM Anda.
Langkah-8 Buat file docker-compose.yml
Masuk ke folder /crunchify/prometheus.
|
1 2 3 |
root @ localhost : / crunchify # cd /crunchify/prometheus/ root @ localhost : / crunchify / prometheus # vi docker-compose.yml |
konten file docker-compose.yml:
|
1 2 3 4 5 6 7 8 9 10 11 12 13 14 |
version : "3" services : prometheus : image : prom / prometheus : latest container_name : prometheus volumes : - / crunchify / prometheus / conf : / etc / prometheus - / crunchify / prometheus / data : / prometheus command : - '--config.file=/etc/prometheus/prometheus.yml' - '--storage.tsdb.path=/prometheus' ports : - "9090:9090" |
Langkah-9 Instal Prometheus Start/Stop sebagai bagian dari kontrol sistem.
Buat file vi /etc/systemd/system/prometheus.service
konten file prometheus.service:
|
1 2 3 4 5 6 7 8 9 10 11 12 13 14 15 16 17 |
[ Unit ] Description = Prometheus monitoring docker container After = docker . service BindsTo = docker . service [ Service ] Restart = always WorkingDirectory =/ crunchify / prometheus / # Ubuntu ExecStart =/ usr / bin / docker - compose up ExecStop =/ usr / bin / docker - compose down # CentOS #ExecStart=/usr/bin/docker-compose up #ExecStop=/usr/bin/docker-compose down [ Install ] WantedBy = multi - user . target |

Langkah-10 Mulai layanan Prometheus
|
1 2 3 4 5 6 |
root @ localhost : / crunchify / prometheus / config # sudo systemctl daemon-reload root @ localhost : / crunchify / prometheus / config # sudo systemctl enable prometheus Created symlink / etc / systemd / system / multi - user . target . wants / prometheus . service → / etc / systemd / system / prometheus . service . root @ localhost : / crunchify / prometheus / config # sudo systemctl start prometheus |
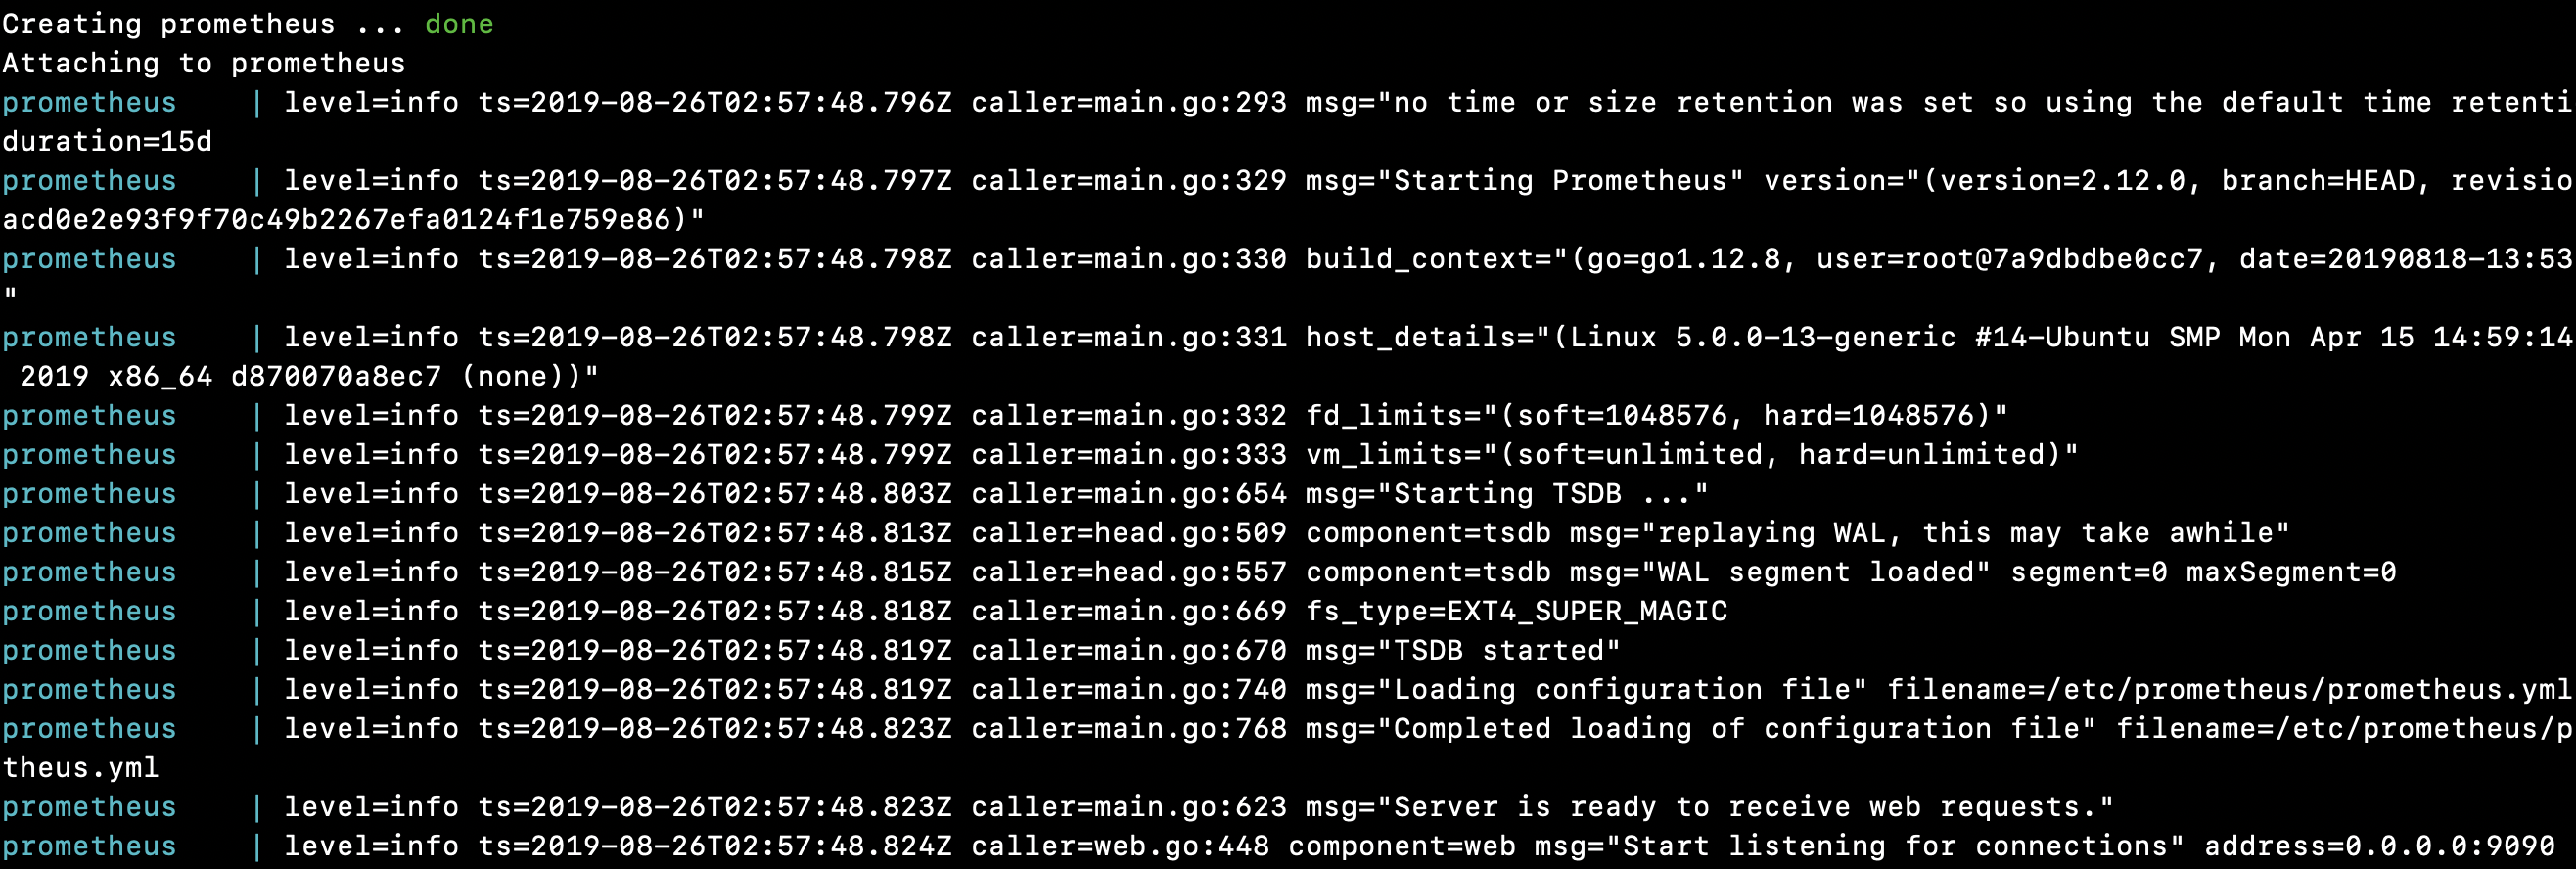
Server Prometheus Dimulai di Linux:
|
1 2 3 4 5 6 7 8 9 10 11 12 13 14 15 16 17 18 19 20 21 22 23 24 25 26 27 28 29 30 31 32 |
root @ localhost : / crunchify / prometheus # sudo systemctl start prometheus Creating network "prometheus_default" with the default driver Pulling prometheus ( prom / prometheus : latest ) . . . latest : Pulling from prom / prometheus 8e674ad76dce : Pull complete e77d2419d1c2 : Pull complete d7c0a2a2ca7e : Pull complete bd46de67c79d : Pull complete 35f6078df7e9 : Pull complete 8b3f04e26151 : Pull complete 9d234d9c8a77 : Pull complete 1a8a2a4f314d : Pull complete 62e28fd716ec : Pull complete Digest : sha256 : cd93b8711bb92eb9c437d74217311519e0a93bc55779aa664325dc83cd13cb32 Status : Downloaded newer image for prom / prometheus : latest Creating prometheus . . . done Attaching to prometheus prometheus | level = info ts = 2019 - 08 - 26T02 : 57 : 48.796Z caller = main . go : 293 msg = "no time or size retention was set so using the default time retention" duration = 15d prometheus | level = info ts = 2019 - 08 - 26T02 : 57 : 48.797Z caller = main . go : 329 msg = "Starting Prometheus" version = "(version=2.12.0, branch=HEAD, revision=43acd0e2e93f9f70c49b2267efa0124f1e759e86)" prometheus | level = info ts = 2019 - 08 - 26T02 : 57 : 48.798Z caller = main . go : 330 build_context = "(go=go1.12.8, user=root@7a9dbdbe0cc7, date=20190818-13:53:16)" prometheus | level = info ts = 2019 - 08 - 26T02 : 57 : 48.798Z caller = main . go : 331 host_details = "(Linux 5.0.0-13-generic #14-Ubuntu SMP Mon Apr 15 14:59:14 UTC 2019 x86_64 d870070a8ec7 (none))" prometheus | level = info ts = 2019 - 08 - 26T02 : 57 : 48.799Z caller = main . go : 332 fd_limits = "(soft=1048576, hard=1048576)" prometheus | level = info ts = 2019 - 08 - 26T02 : 57 : 48.799Z caller = main . go : 333 vm_limits = "(soft=unlimited, hard=unlimited)" prometheus | level = info ts = 2019 - 08 - 26T02 : 57 : 48.803Z caller = main . go : 654 msg = "Starting TSDB ..." prometheus | level = info ts = 2019 - 08 - 26T02 : 57 : 48.813Z caller = head . go : 509 component = tsdb msg = "replaying WAL, this may take awhile" prometheus | level = info ts = 2019 - 08 - 26T02 : 57 : 48.815Z caller = head . go : 557 component = tsdb msg = "WAL segment loaded" segment = 0 maxSegment = 0 prometheus | level = info ts = 2019 - 08 - 26T02 : 57 : 48.818Z caller = main . go : 669 fs_type = EXT4_SUPER_MAGIC prometheus | level = info ts = 2019 - 08 - 26T02 : 57 : 48.819Z caller = main . go : 670 msg = "TSDB started" prometheus | level = info ts = 2019 - 08 - 26T02 : 57 : 48.819Z caller = main . go : 740 msg = "Loading configuration file" filename =/ etc / prometheus / prometheus . yml prometheus | level = info ts = 2019 - 08 - 26T02 : 57 : 48.823Z caller = main . go : 768 msg = "Completed loading of configuration file" filename =/ etc / prometheus / prometheus . yml prometheus | level = info ts = 2019 - 08 - 26T02 : 57 : 48.823Z caller = main . go : 623 msg = "Server is ready to receive web requests." prometheus | level = info ts = 2019 - 08 - 26T02 : 57 : 48.824Z caller = web . go : 448 component = web msg = "Start listening for connections" address = 0.0.0.0 : 9090 |
Selamat!! Anda telah berhasil memulai Prometheus di host Anda.
Mari bermain dengan Dasbor dan UI Prometheus
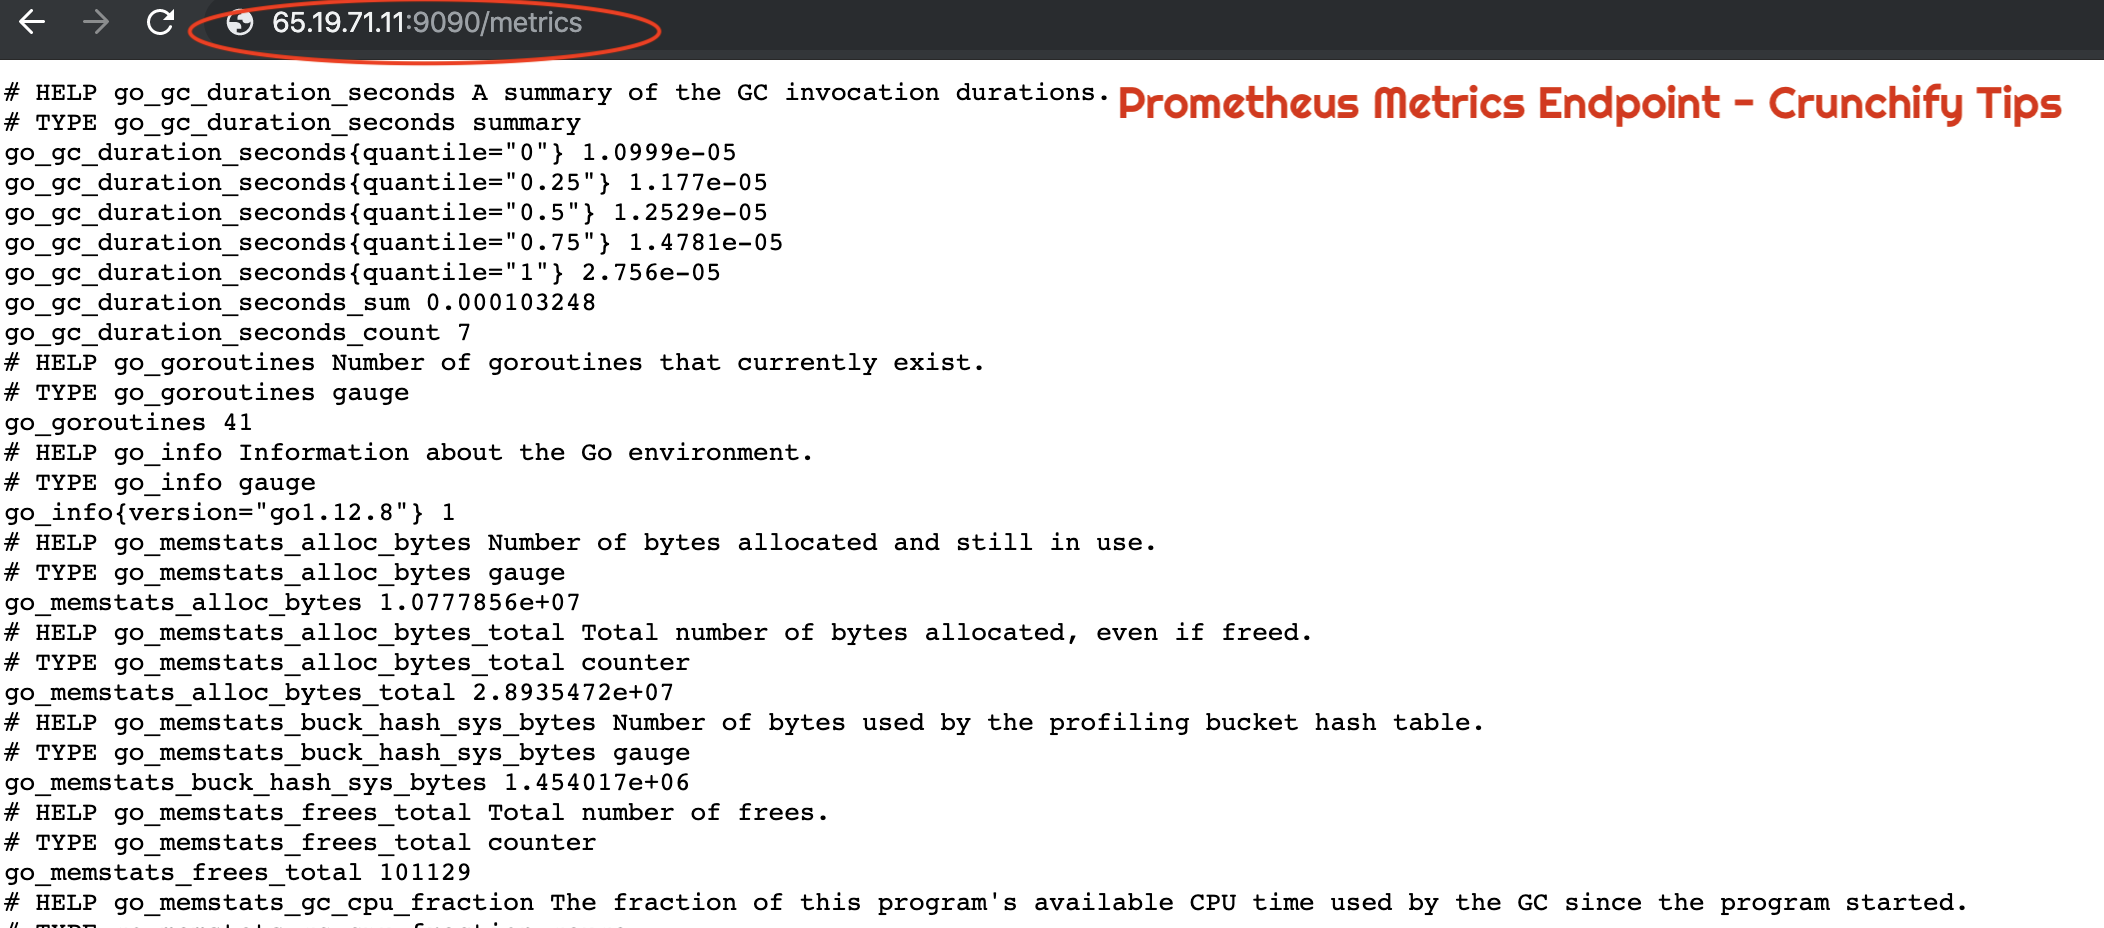
Bagaimana cara memverifikasi apakah Prometheus berjalan dengan benar atau tidak?
|
1 |
URL : http : //65.19.71.11:9090/metrics |
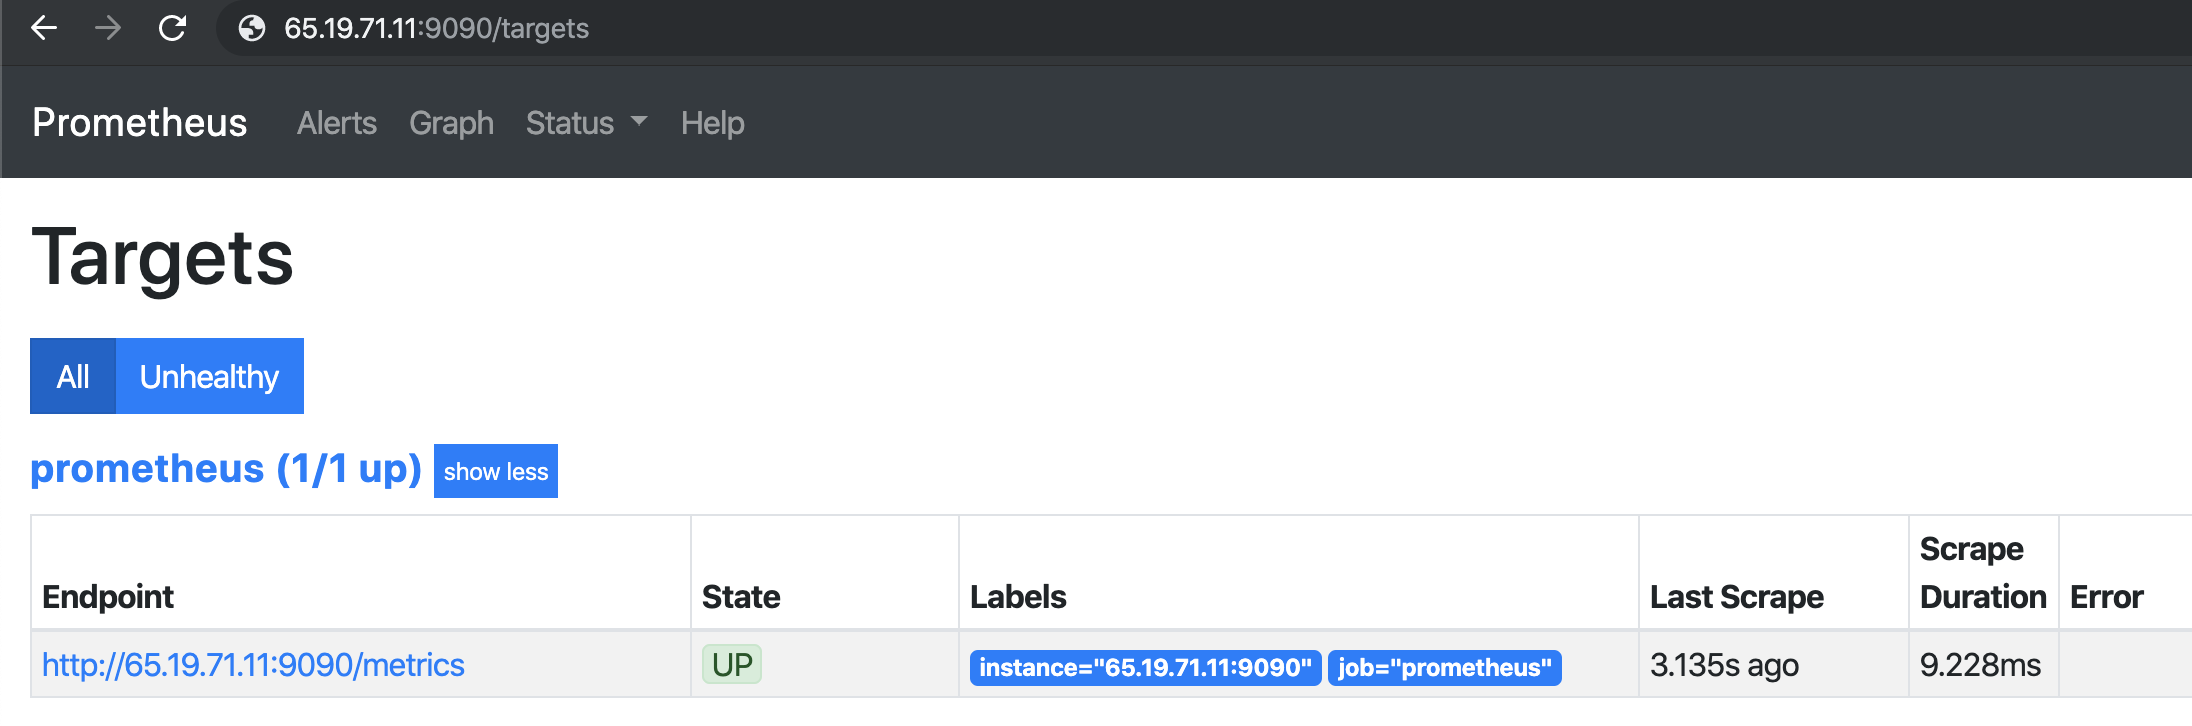
Bagaimana cara memverifikasi status UP Host atau VM menggunakan Prometheus?
|
1 |
URL : http : //65.19.71.11:9090/targets |
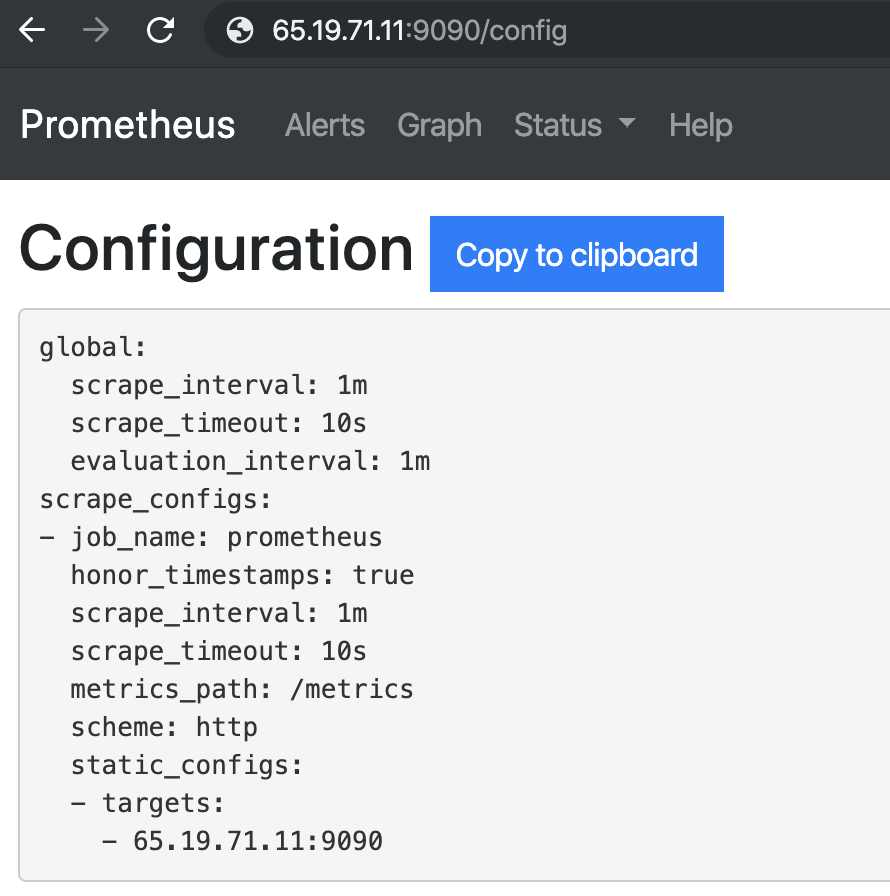
Bagaimana cara memeriksa Konfigurasi Prometheus di Browser?
Informasi Runtime Prometheus
|
1 |
URL : http : //65.19.71.11:9090/status |
| Waktu aktif | 26-08-2019 03:07:24.244852166 +0000 UTC |
|---|---|
| Direktori Kerja | /prometheus |
| Muat ulang konfigurasi | Berhasil |
| Reload konfigurasi terakhir yang berhasil | 26-08-2019 03:07:24 +0000 UTC |
| Potongan kepala | 533 |
| Seri waktu kepala | 533 |
| korupsi WAL | 0 |
| goroutine | 36 |
| GOMAXPROCS | 1 |
| GOGC | |
| GODEBUG | |
| Retensi Penyimpanan | 15d |
Informasi Pembuatan Prometheus
| Versi: kapan | 2.12.0 |
|---|---|
| Revisi | 43acd0e2e93f9f70c49b2267efa0124f1e759e86 |
| Cabang | KEPALA |
| BuildUser | root@7a9dbdbe0cc7 |
| Tanggal Pembuatan | 20190818-13:53:16 |
| Versi Go | go1.12.8 |
Bendera Baris Perintah Prometheus:
|
1 |
URL : http : //65.19.71.11:9090/flags |
| alertmanager.notification-queue-capacity | 10000 |
|---|---|
| alertmanager.timeout | 10 detik |
| file konfigurasi | /etc/prometheus/prometheus.yml |
| log.format | logfmt |
| log.level | informasi |
| query.lookback-delta | 5m |
| query.max-concurrency | 20 |
| query.max-sampel | 50000000 |
| query.timeout | 2m |
| rules.alert.for-grace-period | 10m |
| rules.alert.for-outage-tolerance | 1 jam |
| rules.alert.resend-delay | 1m |
| storage.remote.flush-tenggat waktu | 1m |
| storage.remote.read-concurrent-limit | 10 |
| storage.remote.read-sample-limit | 50000000 |
| storage.tsdb.allow-overlapping-blocks | Salah |
| storage.tsdb.max-block-duration | 36 jam |
| storage.tsdb.min-block-duration | 2 jam |
| penyimpanan.tsdb.no-lockfile | Salah |
| penyimpanan.tsdb.path | /prometheus |
| penyimpanan.tsdb.retention | 0 detik |
| penyimpanan.tsdb.retention.size | 0B |
| penyimpanan.tsdb.retention.time | 0 detik |
| penyimpanan.tsdb.wal-kompresi | Salah |
| storage.tsdb.wal-segment-size | 0B |
| web.console.libraries | console_libraries |
| web.console.template | konsol |
| web.cors.origin | .* |
| web.enable-admin-api | Salah |
| web.enable-siklus hidup | Salah |
| web.external-url | |
| web.listen-address | 0.0.0.0:9090 |
| web.max-koneksi | 512 |
| web.page-title | Server Pengumpulan dan Pemrosesan Seri Waktu Prometheus |
| web.read-timeout | 5m |
| web.route-prefix | / |
Dan Anda sudah siap. Anda telah successfully installed Prometheus dan memverifikasi semua fiturnya.