
LinuxにPrometheusをインストールして構成する方法は? (UbuntuとCentOS)
公開: 2019-08-26
プロメテウスとは何ですか?
Prometheusは世界クラスの監視システムであり、デフォルトで時系列データベースが付属しています。 これは、もともと2012年に構築されたオープンソースシステムです。
世界のトップ500企業は、インフラストラクチャとアプリケーションのメトリックを収集するためにPrometheusを使用しています。 Prometheusは、主にメトリクスとして識別される時系列データを使用した多次元データモデルをサポートしています。
Prometheusは独自のインストールの一部であるTimeSeries Time Series DB (TSDB)を使用するため、特別なデータストレージ要件はありません。
このチュートリアルでは、非常に簡単な手順でLinuxUbuntuとCentOSにPrometheusをインストールします。
始めましょう:
ステップ-1LinuxOSのバージョンを確認する
コマンド: cat /etc/os-release
|
1 2 3 4 5 6 7 8 9 10 11 12 13 |
root @ localhost : ~ # cat /etc/os-release NAME = "Ubuntu" VERSION = "19.04 (Disco Dingo)" ID = ubuntu ID_LIKE = debian PRETTY_NAME = "Ubuntu 19.04" VERSION_ID = "19.04" HOME_URL = "https://www.ubuntu.com/" SUPPORT_URL = "https://help.ubuntu.com/" BUG_REPORT_URL = "https://bugs.launchpad.net/ubuntu/" PRIVACY_POLICY_URL = "https://www.ubuntu.com/legal/terms-and-policies/privacy-policy" VERSION_CODENAME = disco UBUNTU_CODENAME = disco |
以下の手順は、 Ubuntu Linux OSに適用されます。
ステップ-2Prometheusデータと構成フォルダーを作成する
コマンド:
|
1 2 3 |
root @ localhost : ~ # sudo mkdir /crunchify/prometheus/conf root @ localhost : ~ # sudo mkdir /crunchify/prometheus/data |
両方のフォルダを確認しましょう:
|
1 2 3 4 5 6 7 8 9 |
root @ localhost : / crunchify / prometheus # pwd / crunchify / prometheus root @ localhost : / crunchify / prometheus # ls -ltra total 16 drwxr - xr - x 2 root root 4096 Aug 25 23 : 37 conf drwxr - xr - x 3 root root 4096 Aug 25 23 : 37 . . drwxr - xr - x 2 root root 4096 Aug 25 23 : 37 data drwxr - xr - x 4 root root 4096 Aug 25 23 : 37 . |
ステップ-3データフォルダの所有権を変更する
これは、後の手順での権限の問題を回避するために必要です。
|
1 |
root @ localhost : / crunchify / prometheus # sudo chown 65534:65534 /crunchify/prometheus/data/ |
ステップ-4prometheus.ymlファイルを作成する
フォルダ/crunchify/prometheus/confに移動し、ファイルprometheus.ymlを作成します。
|
1 2 3 |
root @ localhost : / # cd /crunchify/prometheus/conf root @ localhost : / crunchify / prometheus / conf # vi prometheus.yml |
prometheus.ymlファイルの内容:
|
1 2 3 4 5 6 7 8 9 10 11 12 13 14 15 16 17 18 19 20 21 22 23 24 25 26 27 28 29 |
# my global config global : scrape_interval : 15s # Set the scrape interval to every 15 seconds. Default is every 1 minute. evaluation_interval : 15s # Evaluate rules every 15 seconds. The default is every 1 minute. # scrape_timeout is set to the global default (10s). # Alertmanager configuration alerting : alertmanagers : - static_configs : - targets : # - alertmanager:9093 # Load rules once and periodically evaluate them according to the global 'evaluation_interval'. rule_files : # - "first_rules.yml" # - "second_rules.yml" # A scrape configuration containing exactly one endpoint to scrape: # Here it's Prometheus itself. scrape_configs : # The job name is added as a label `job=<job_name>` to any time series scraped from this config. - job_name : 'prometheus' # metrics_path defaults to '/metrics' # scheme defaults to 'http'. static_configs : - targets : [ '65.19.71.11:9090' ] |
Note:上記のファイルで–IPをホスト/ VMIPに置き換えます。
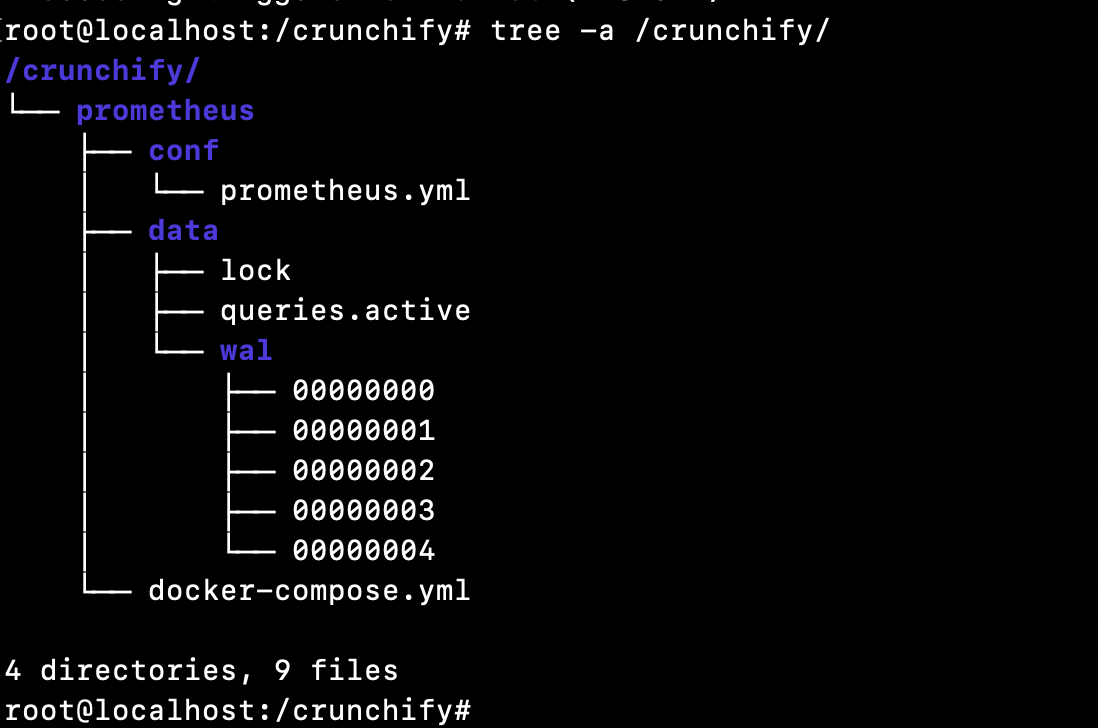
このチュートリアルのDirectory structureは次のとおりです。
ステップ-5VMにDockerがインストールされていることを確認します。
Dockerがインストールされているかどうかを確認するにはどうすればよいですか?
|
1 2 3 |
root @ localhost : ~ # docker Command 'docker' not found |
これは、Dockerがホスト/ VMにインストールされていないことを意味します。 Dockerインストールチュートリアルに完全に従って、ホスト/ VMにDockerをインストールしてください。
ステップ-6DockerComposeをインストールします
Pre-requisiteは、以下の手順を実行する前に、まずDockerをインストールすることです。 (ステップ-5)
以下の3つのコマンドを実行します。
|
1 2 3 4 5 6 7 8 9 |
root @ localhost : ~ # sudo curl -L "https://github.com/docker/compose/releases/download/1.24.1/docker-compose-$(uname -s)-$(uname -m)" -o /usr/local/bin/docker-compose % Total % Received % Xferd Average Speed Time Time Time Current Dload Upload Total Spent Left Speed 100 617 0 617 0 0 2448 0 -- : -- : -- -- : -- : -- -- : -- : -- 2448 100 15.4M 100 15.4M 0 0 11.2M 0 0 : 00 : 01 0 : 00 : 01 -- : -- : -- 15.7M root @ localhost : ~ # sudo chmod +x /usr/local/bin/docker-compose root @ localhost : ~ # sudo ln -s /usr/local/bin/docker-compose /usr/bin/docker-compose |
ステップ-7DockerComposeバージョンを確認する
|
1 2 3 |
root @ localhost : ~ # docker-compose --version docker - compose version 1.24.1 , build 4667896b |
おめでとうございます– dockercomposeがVMに正常にインストールされました。
ステップ-8docker-compose.ymlファイルを作成します
/ crunchify / prometheusフォルダーに移動します。
|
1 2 3 |
root @ localhost : / crunchify # cd /crunchify/prometheus/ root @ localhost : / crunchify / prometheus # vi docker-compose.yml |
docker-compose.ymlファイルの内容:
|
1 2 3 4 5 6 7 8 9 10 11 12 13 14 |
version : "3" services : prometheus : image : prom / prometheus : latest container_name : prometheus volumes : - / crunchify / prometheus / conf : / etc / prometheus - / crunchify / prometheus / data : / prometheus command : - '--config.file=/etc/prometheus/prometheus.yml' - '--storage.tsdb.path=/prometheus' ports : - "9090:9090" |
ステップ-9システム制御の一部としてPrometheusStart / Stopをインストールします。
ファイルvi /etc/systemd/system/prometheus.serviceを作成します
prometheus.serviceファイルの内容:
|
1 2 3 4 5 6 7 8 9 10 11 12 13 14 15 16 17 |
[ Unit ] Description = Prometheus monitoring docker container After = docker . service BindsTo = docker . service [ Service ] Restart = always WorkingDirectory =/ crunchify / prometheus / # Ubuntu ExecStart =/ usr / bin / docker - compose up ExecStop =/ usr / bin / docker - compose down # CentOS #ExecStart=/usr/bin/docker-compose up #ExecStop=/usr/bin/docker-compose down [ Install ] WantedBy = multi - user . target |

ステップ-10Prometheusサービスを開始します
|
1 2 3 4 5 6 |
root @ localhost : / crunchify / prometheus / config # sudo systemctl daemon-reload root @ localhost : / crunchify / prometheus / config # sudo systemctl enable prometheus Created symlink / etc / systemd / system / multi - user . target . wants / prometheus . service → / etc / systemd / system / prometheus . service . root @ localhost : / crunchify / prometheus / config # sudo systemctl start prometheus |
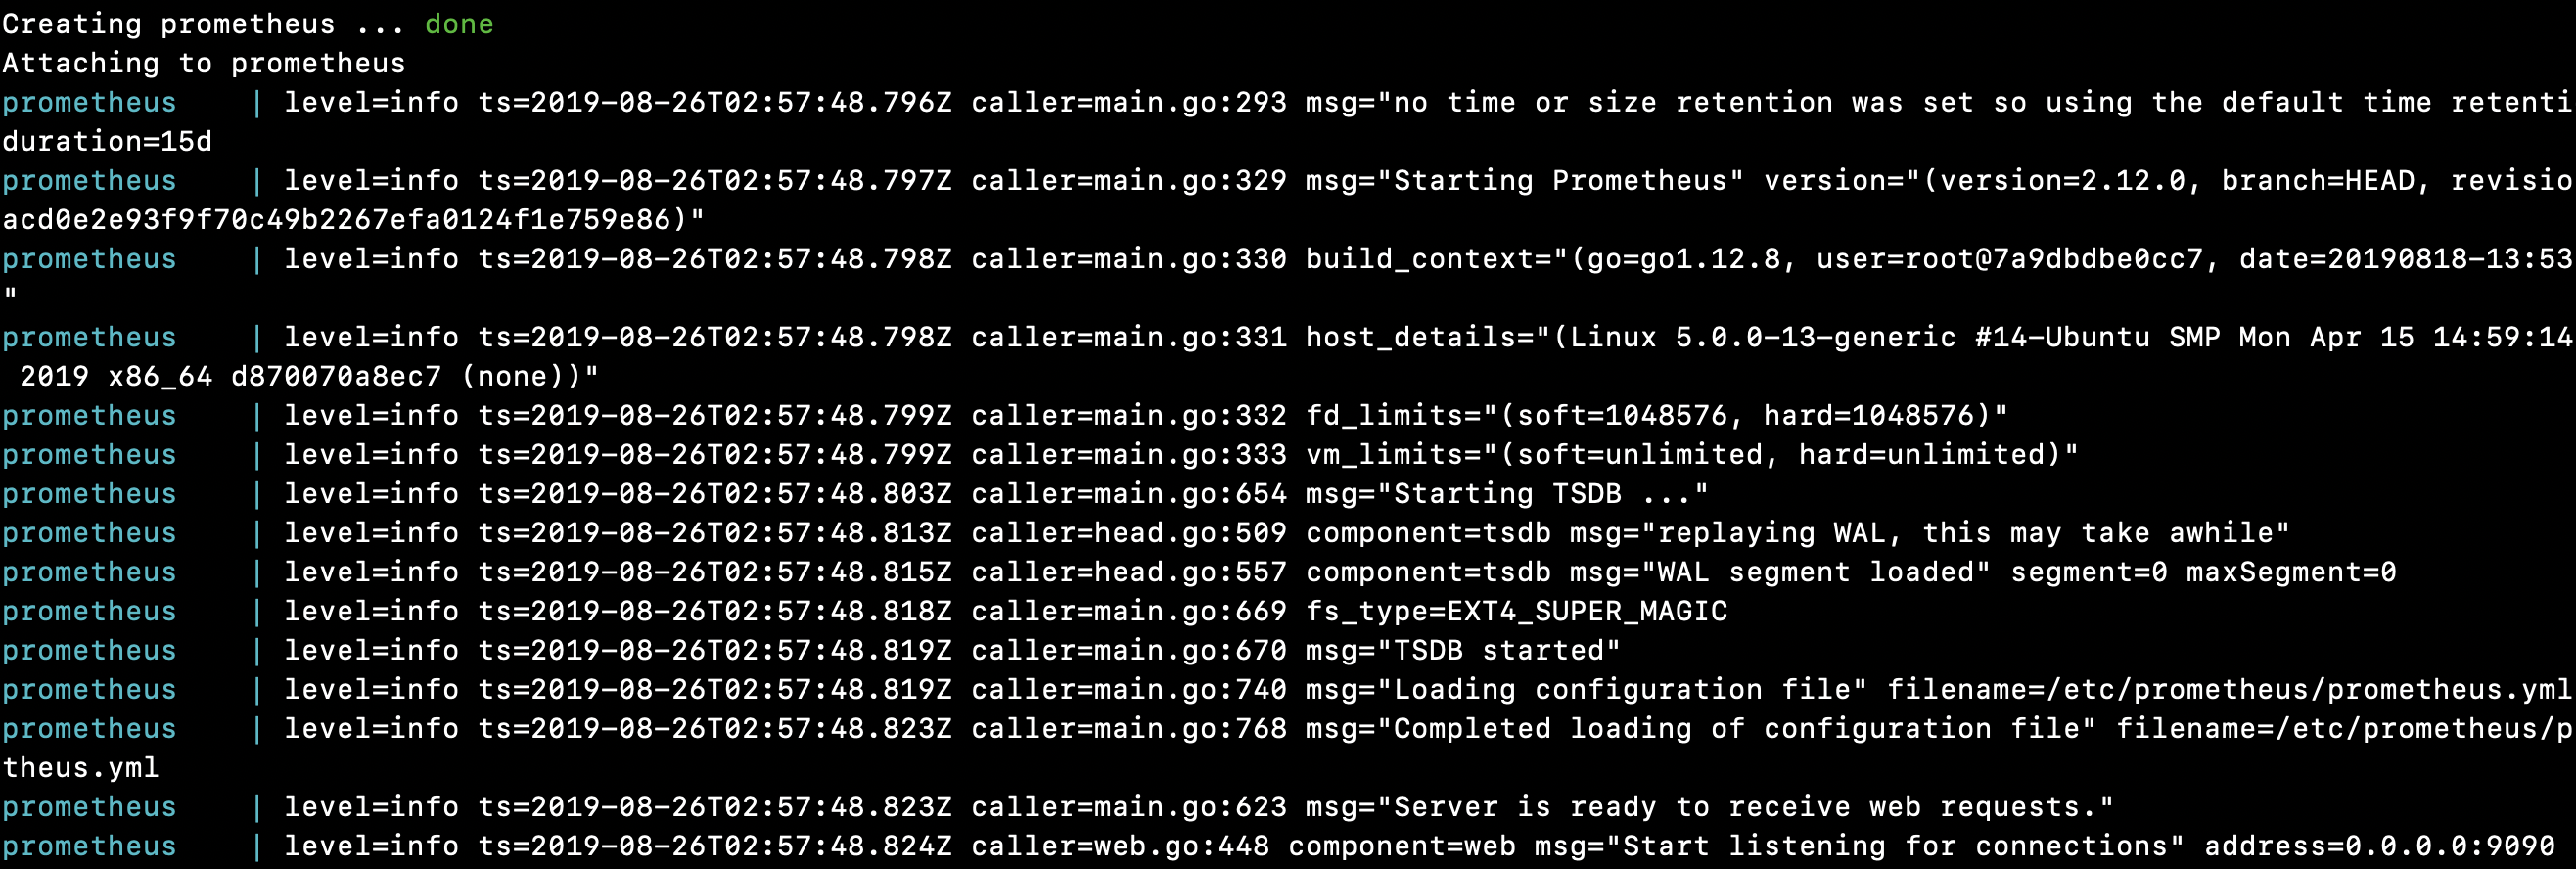
Linuxで起動したPrometheusサーバー:
|
1 2 3 4 5 6 7 8 9 10 11 12 13 14 15 16 17 18 19 20 21 22 23 24 25 26 27 28 29 30 31 32 |
root @ localhost : / crunchify / prometheus # sudo systemctl start prometheus Creating network "prometheus_default" with the default driver Pulling prometheus ( prom / prometheus : latest ) . . . latest : Pulling from prom / prometheus 8e674ad76dce : Pull complete e77d2419d1c2 : Pull complete d7c0a2a2ca7e : Pull complete bd46de67c79d : Pull complete 35f6078df7e9 : Pull complete 8b3f04e26151 : Pull complete 9d234d9c8a77 : Pull complete 1a8a2a4f314d : Pull complete 62e28fd716ec : Pull complete Digest : sha256 : cd93b8711bb92eb9c437d74217311519e0a93bc55779aa664325dc83cd13cb32 Status : Downloaded newer image for prom / prometheus : latest Creating prometheus . . . done Attaching to prometheus prometheus | level = info ts = 2019 - 08 - 26T02 : 57 : 48.796Z caller = main . go : 293 msg = "no time or size retention was set so using the default time retention" duration = 15d prometheus | level = info ts = 2019 - 08 - 26T02 : 57 : 48.797Z caller = main . go : 329 msg = "Starting Prometheus" version = "(version=2.12.0, branch=HEAD, revision=43acd0e2e93f9f70c49b2267efa0124f1e759e86)" prometheus | level = info ts = 2019 - 08 - 26T02 : 57 : 48.798Z caller = main . go : 330 build_context = "(go=go1.12.8, user=root@7a9dbdbe0cc7, date=20190818-13:53:16)" prometheus | level = info ts = 2019 - 08 - 26T02 : 57 : 48.798Z caller = main . go : 331 host_details = "(Linux 5.0.0-13-generic #14-Ubuntu SMP Mon Apr 15 14:59:14 UTC 2019 x86_64 d870070a8ec7 (none))" prometheus | level = info ts = 2019 - 08 - 26T02 : 57 : 48.799Z caller = main . go : 332 fd_limits = "(soft=1048576, hard=1048576)" prometheus | level = info ts = 2019 - 08 - 26T02 : 57 : 48.799Z caller = main . go : 333 vm_limits = "(soft=unlimited, hard=unlimited)" prometheus | level = info ts = 2019 - 08 - 26T02 : 57 : 48.803Z caller = main . go : 654 msg = "Starting TSDB ..." prometheus | level = info ts = 2019 - 08 - 26T02 : 57 : 48.813Z caller = head . go : 509 component = tsdb msg = "replaying WAL, this may take awhile" prometheus | level = info ts = 2019 - 08 - 26T02 : 57 : 48.815Z caller = head . go : 557 component = tsdb msg = "WAL segment loaded" segment = 0 maxSegment = 0 prometheus | level = info ts = 2019 - 08 - 26T02 : 57 : 48.818Z caller = main . go : 669 fs_type = EXT4_SUPER_MAGIC prometheus | level = info ts = 2019 - 08 - 26T02 : 57 : 48.819Z caller = main . go : 670 msg = "TSDB started" prometheus | level = info ts = 2019 - 08 - 26T02 : 57 : 48.819Z caller = main . go : 740 msg = "Loading configuration file" filename =/ etc / prometheus / prometheus . yml prometheus | level = info ts = 2019 - 08 - 26T02 : 57 : 48.823Z caller = main . go : 768 msg = "Completed loading of configuration file" filename =/ etc / prometheus / prometheus . yml prometheus | level = info ts = 2019 - 08 - 26T02 : 57 : 48.823Z caller = main . go : 623 msg = "Server is ready to receive web requests." prometheus | level = info ts = 2019 - 08 - 26T02 : 57 : 48.824Z caller = web . go : 448 component = web msg = "Start listening for connections" address = 0.0.0.0 : 9090 |
おめでとう!! ホストでPrometheusを正常に起動しました。
PrometheusダッシュボードとUIで遊んでみましょう
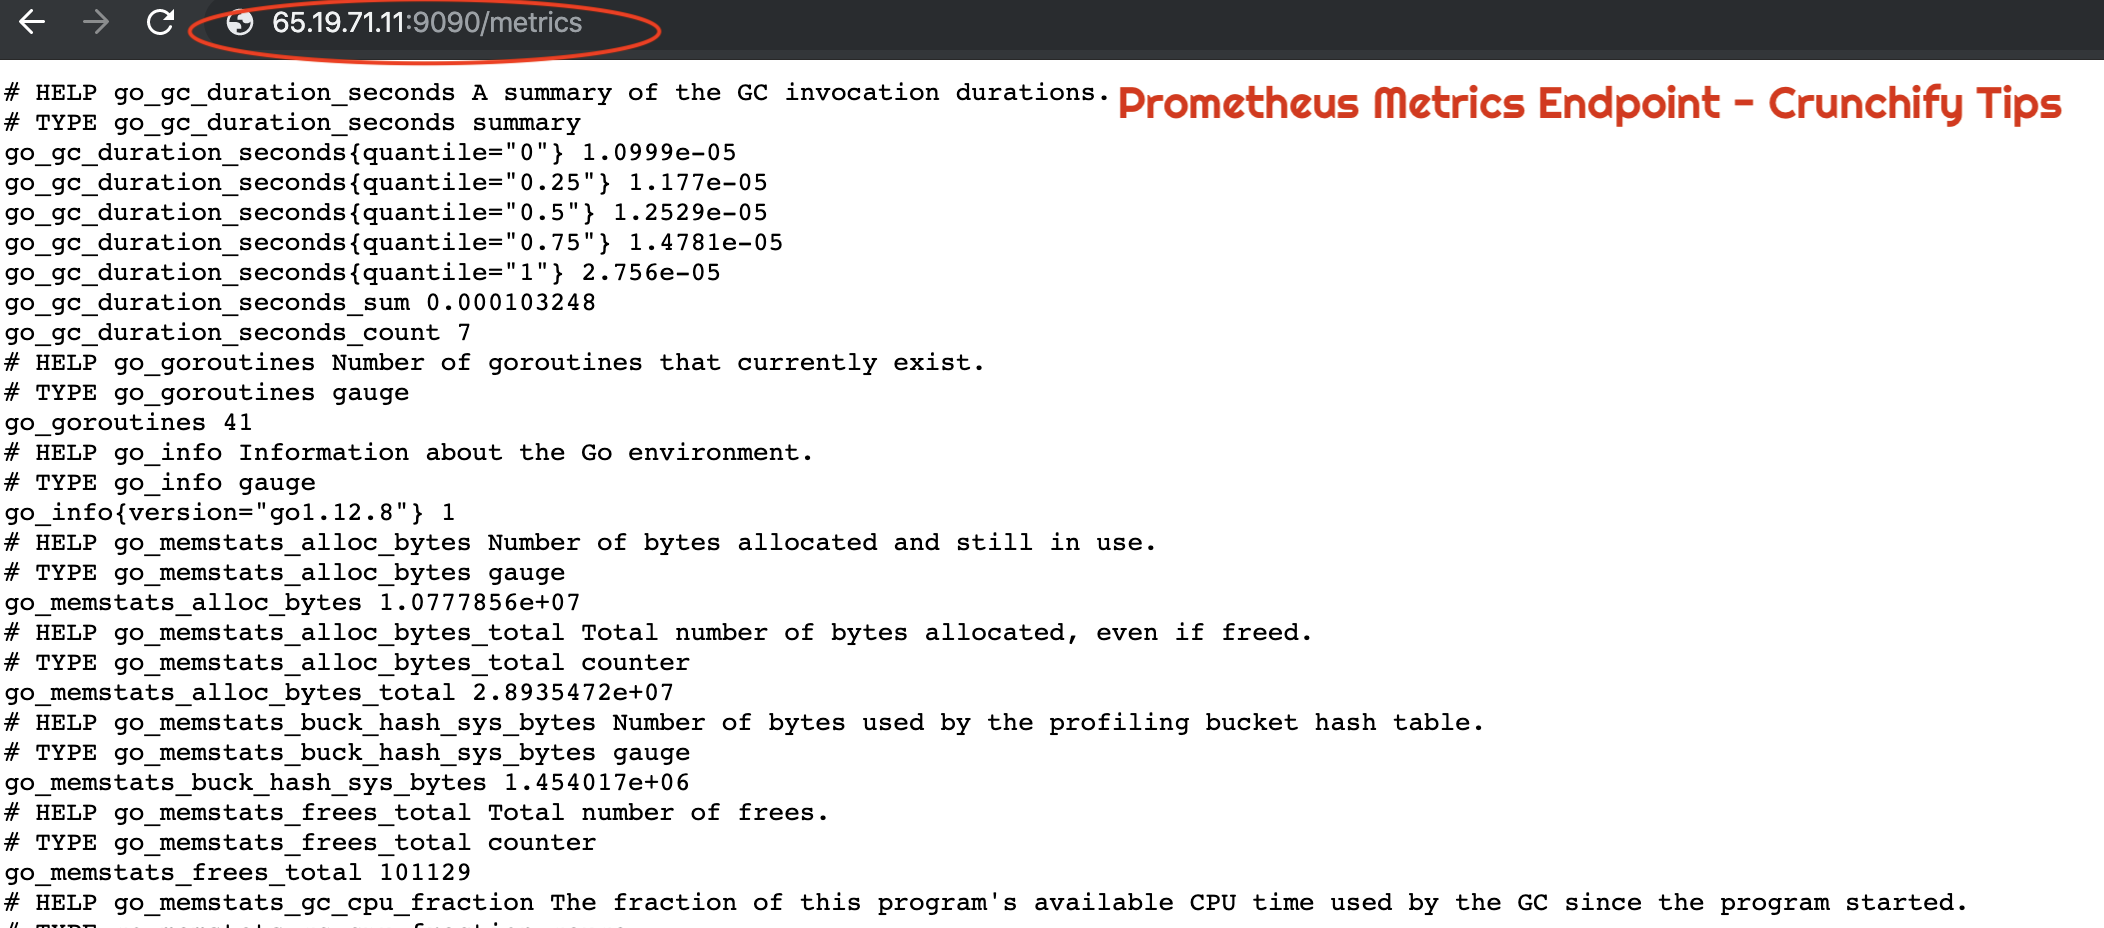
Prometheusが正しく実行されているかどうかを確認するにはどうすればよいですか?
|
1 |
URL : http : //65.19.71.11:9090/metrics |
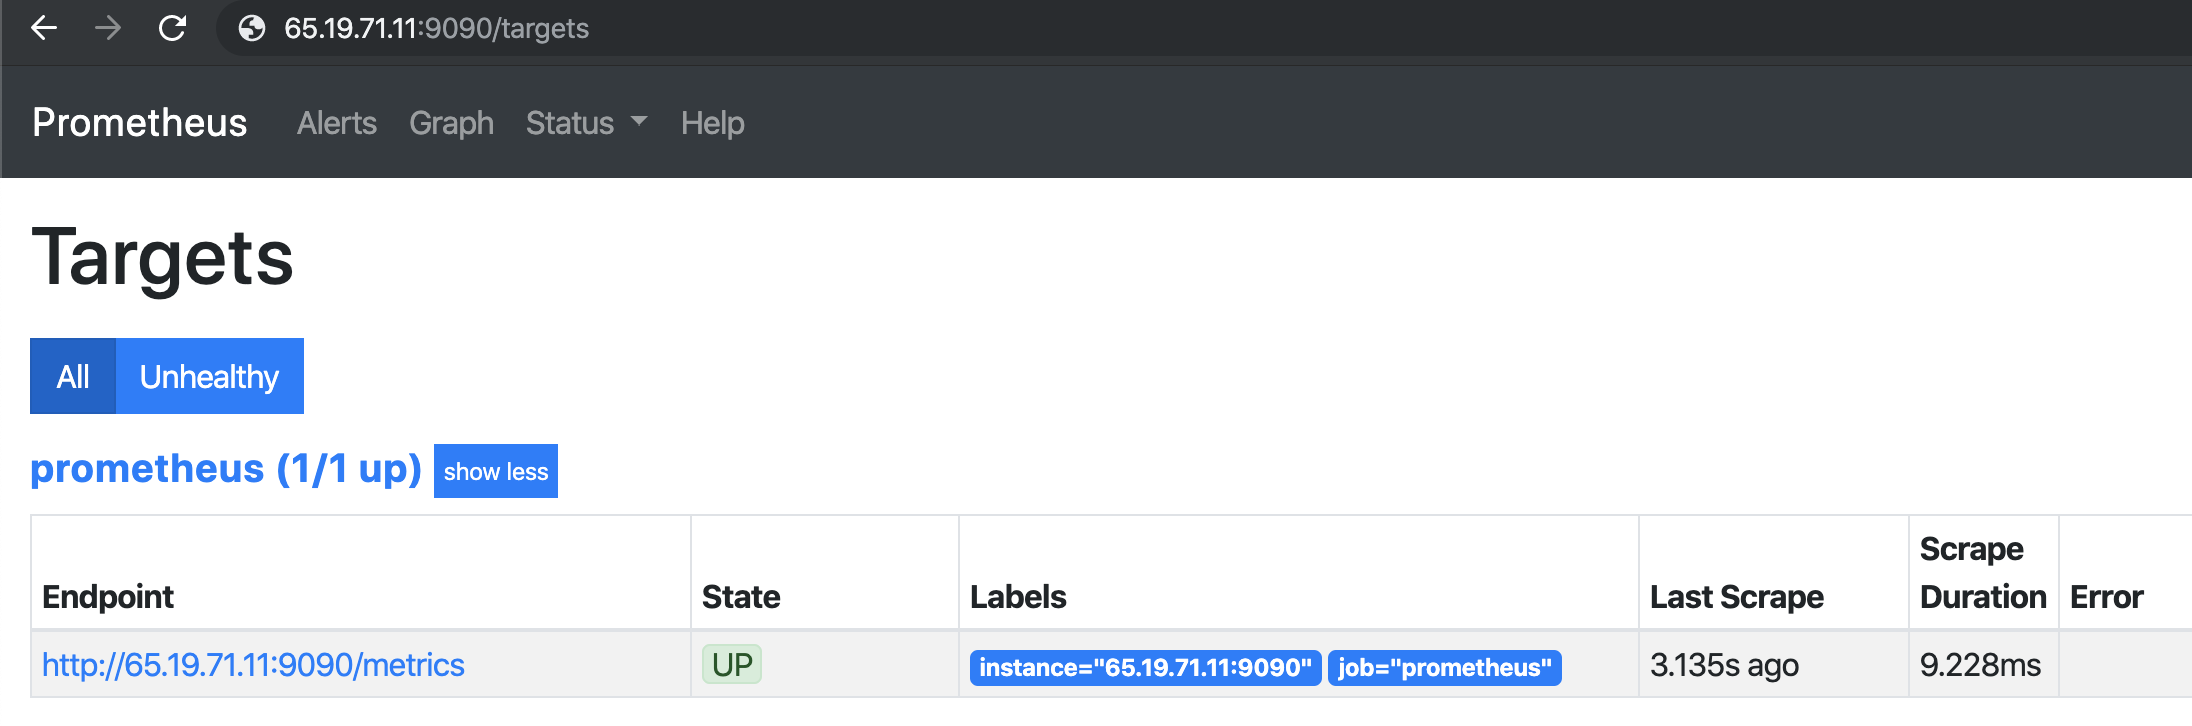
Prometheusを使用してホストまたはVMのUPステータスを確認するにはどうすればよいですか?
|
1 |
URL : http : //65.19.71.11:9090/targets |
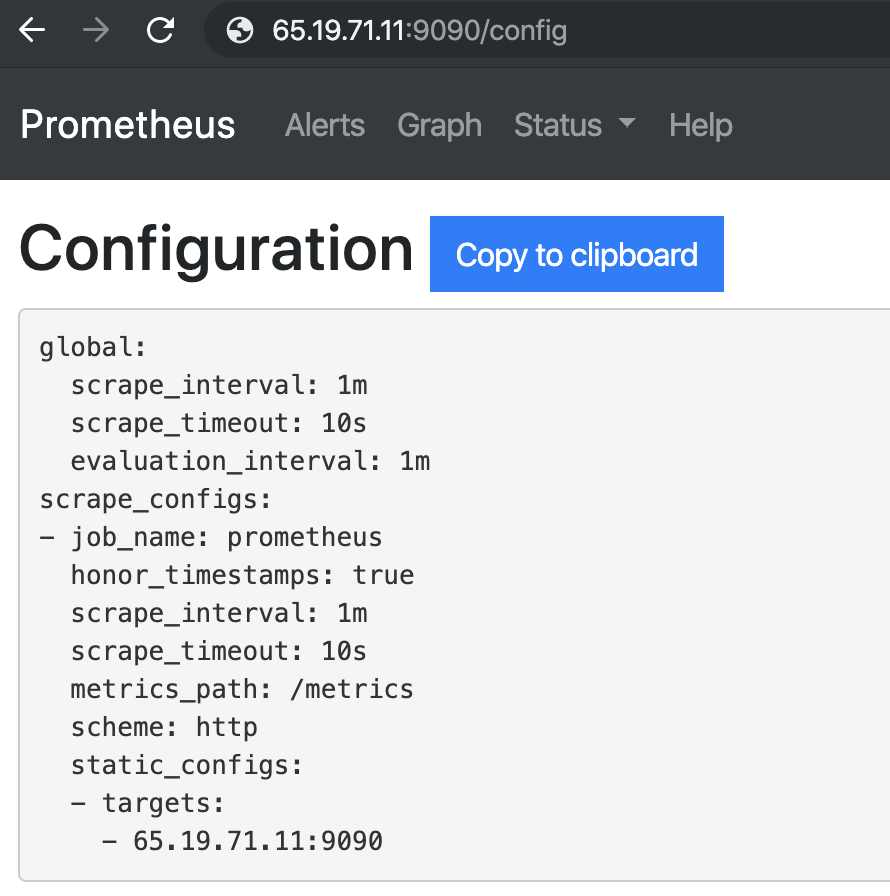
ブラウザでPrometheusの設定を確認するにはどうすればよいですか?
Prometheusランタイム情報
|
1 |
URL : http : //65.19.71.11:9090/status |
| 稼働時間 | 2019-08-26 03:07:24.244852166 +0000 UTC |
|---|---|
| 作業ディレクトリ | / prometheus |
| 構成のリロード | 成功 |
| 最後に成功した構成のリロード | 2019-08-26 03:07:24 +0000 UTC |
| ヘッドチャンク | 533 |
| ヘッド時系列 | 533 |
| WALの破損 | 0 |
| Goroutines | 36 |
| GOMAXPROCS | 1 |
| GOGC | |
| GODEBUG | |
| ストレージの保持 | 15日 |
Prometheusビルド情報
| バージョン | 2.12.0 |
|---|---|
| リビジョン | 43acd0e2e93f9f70c49b2267efa0124f1e759e86 |
| ブランチ | 頭 |
| BuildUser | root @ 7a9dbdbe0cc7 |
| 建設日 | 20190818-13:53:16 |
| GoVersion | go1.12.8 |
Prometheusコマンドラインフラグ:
|
1 |
URL : http : //65.19.71.11:9090/flags |
| alertmanager.notification-queue-capacity | 10000 |
|---|---|
| alertmanager.timeout | 10秒 |
| config.file | /etc/prometheus/prometheus.yml |
| log.format | logfmt |
| log.level | 情報 |
| query.lookback-delta | 5メートル |
| query.max-並行性 | 20 |
| query.max-サンプル | 50000000 |
| query.timeout | 2メートル |
| rules.alert.for-grace-period | 10メートル |
| rules.alert.for-outage-tolerance | 1時間 |
| rules.alert.resend-delay | 1m |
| storage.remote.flush-締め切り | 1m |
| storage.remote.read-concurrent-limit | 10 |
| storage.remote.read-sample-limit | 50000000 |
| storage.tsdb.allow-overlapping-blocks | false |
| storage.tsdb.max-block-duration | 36時間 |
| storage.tsdb.min-block-duration | 2時間 |
| storage.tsdb.no-lockfile | false |
| storage.tsdb.path | / prometheus |
| storage.tsdb.retention | 0秒 |
| storage.tsdb.retention.size | 0B |
| storage.tsdb.retention.time | 0秒 |
| storage.tsdb.wal-compression | false |
| storage.tsdb.wal-segment-size | 0B |
| web.console.libraries | console_libraries |
| web.console.templates | コンソール |
| web.cors.origin | 。* |
| web.enable-admin-api | false |
| web.enable-lifecycle | false |
| web.external-url | |
| web.listen-address | 0.0.0.0:9090 |
| web.max-接続 | 512 |
| web.page-title | Prometheus時系列収集および処理サーバー |
| web.read-timeout | 5メートル |
| web.route-prefix | / |
そして、あなたはすべて準備ができています。 これで、 successfully installed Prometheusれ、すべての機能が検証されました。