
Comment installer et configurer Prometheus sous Linux ? (Ubuntu et CentOS)
Publié: 2019-08-26
Qu'est-ce que Prométhée ?
Prometheus est un système de surveillance de classe mondiale livré avec une base de données de séries chronologiques par défaut. C'est un système open-source construit à l'origine en 2012.
Les 500 plus grandes entreprises du monde utilisent Prometheus pour collecter des métriques pour leur infrastructure et leurs applications. Prometheus prend en charge le modèle de données multidimensionnel avec des données de séries chronologiques principalement identifiées comme des métriques.
Il n'y a pas d'exigence particulière en matière de stockage de données car Prometheus utilise la partie Time Series DB (TSDB) de sa propre installation.
Dans ce didacticiel, nous allons installer Prometheus sur Linux Ubuntu et CentOS en quelques étapes très simples.
Commençons:
Étape 1 Vérifier la version du système d'exploitation Linux
Commande : cat /etc/os-release
|
1 2 3 4 5 6 7 8 9 10 11 12 13 |
root @ localhost : ~ # cat /etc/os-release NAME = "Ubuntu" VERSION = "19.04 (Disco Dingo)" ID = ubuntu ID_LIKE = debian PRETTY_NAME = "Ubuntu 19.04" VERSION_ID = "19.04" HOME_URL = "https://www.ubuntu.com/" SUPPORT_URL = "https://help.ubuntu.com/" BUG_REPORT_URL = "https://bugs.launchpad.net/ubuntu/" PRIVACY_POLICY_URL = "https://www.ubuntu.com/legal/terms-and-policies/privacy-policy" VERSION_CODENAME = disco UBUNTU_CODENAME = disco |
Les étapes ci-dessous s'appliquent au système d' Ubuntu Linux OS .
Étape 2 Créer un dossier de données et de configuration Prometheus
Commandes :
|
1 2 3 |
root @ localhost : ~ # sudo mkdir /crunchify/prometheus/conf root @ localhost : ~ # sudo mkdir /crunchify/prometheus/data |
Vérifions les deux dossiers :
|
1 2 3 4 5 6 7 8 9 |
root @ localhost : / crunchify / prometheus # pwd / crunchify / prometheus root @ localhost : / crunchify / prometheus # ls -ltra total 16 drwxr - xr - x 2 root root 4096 Aug 25 23 : 37 conf drwxr - xr - x 3 root root 4096 Aug 25 23 : 37 . . drwxr - xr - x 2 root root 4096 Aug 25 23 : 37 data drwxr - xr - x 4 root root 4096 Aug 25 23 : 37 . |
Étape 3 Changer la propriété du dossier Data
Ceci est nécessaire pour éviter les problèmes d'autorisation dans les étapes ultérieures.
|
1 |
root @ localhost : / crunchify / prometheus # sudo chown 65534:65534 /crunchify/prometheus/data/ |
Étape 4 Créez le fichier prometheus.yml
Allez dans le dossier /crunchify/prometheus/conf et créez le fichier prometheus.yml .
|
1 2 3 |
root @ localhost : / # cd /crunchify/prometheus/conf root @ localhost : / crunchify / prometheus / conf # vi prometheus.yml |
Contenu du fichier prometheus.yml :
|
1 2 3 4 5 6 7 8 9 10 11 12 13 14 15 16 17 18 19 20 21 22 23 24 25 26 27 28 29 |
# my global config global : scrape_interval : 15s # Set the scrape interval to every 15 seconds. Default is every 1 minute. evaluation_interval : 15s # Evaluate rules every 15 seconds. The default is every 1 minute. # scrape_timeout is set to the global default (10s). # Alertmanager configuration alerting : alertmanagers : - static_configs : - targets : # - alertmanager:9093 # Load rules once and periodically evaluate them according to the global 'evaluation_interval'. rule_files : # - "first_rules.yml" # - "second_rules.yml" # A scrape configuration containing exactly one endpoint to scrape: # Here it's Prometheus itself. scrape_configs : # The job name is added as a label `job=<job_name>` to any time series scraped from this config. - job_name : 'prometheus' # metrics_path defaults to '/metrics' # scheme defaults to 'http'. static_configs : - targets : [ '65.19.71.11:9090' ] |
Note: Dans le fichier ci-dessus, remplacez IP par l'adresse IP de votre hôte/VM.
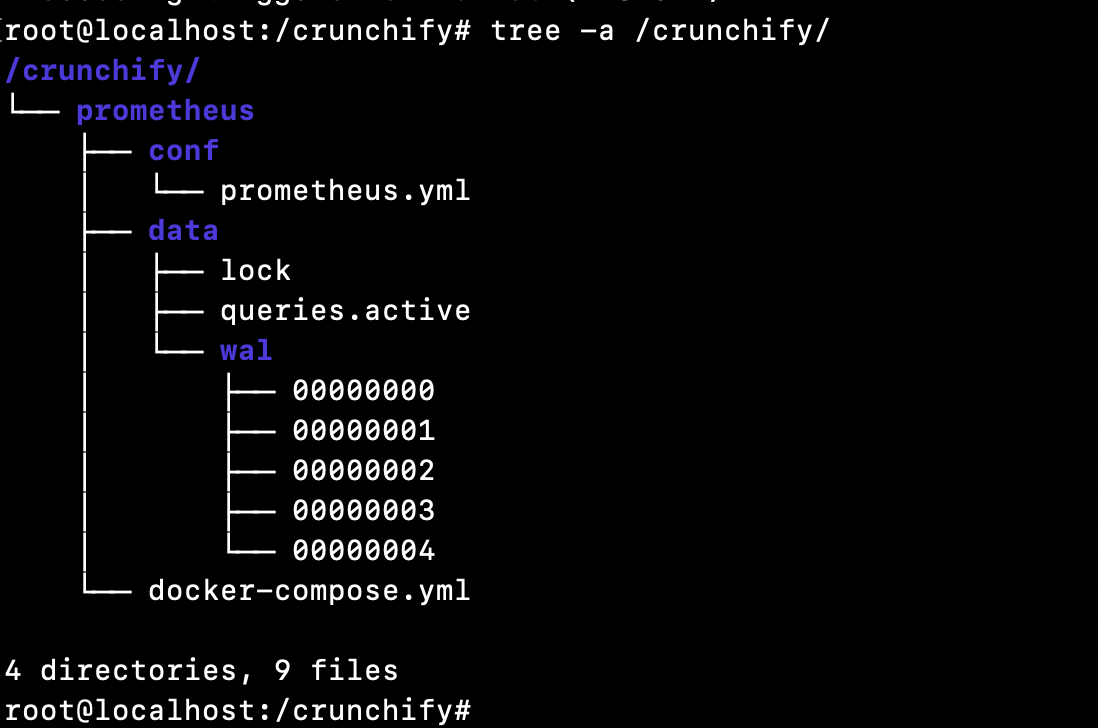
Voici une Directory structure pour ce didacticiel :
Étape 5 Assurez-vous d'avoir installé Docker sur votre machine virtuelle.
Comment vérifier si Docker est installé ou non ?
|
1 2 3 |
root @ localhost : ~ # docker Command 'docker' not found |
Cela signifie que docker n'est pas installé sur votre hôte/VM. Veuillez suivre complètement le didacticiel d'installation de Docker pour installer Docker sur votre hôte/VM.
Étape 6 Installer Docker Compose
Pre-requisiteest d'installer Docker avant d'exécuter les étapes ci-dessous. (Étape-5)
Exécutez ci-dessous trois commandes :
|
1 2 3 4 5 6 7 8 9 |
root @ localhost : ~ # sudo curl -L "https://github.com/docker/compose/releases/download/1.24.1/docker-compose-$(uname -s)-$(uname -m)" -o /usr/local/bin/docker-compose % Total % Received % Xferd Average Speed Time Time Time Current Dload Upload Total Spent Left Speed 100 617 0 617 0 0 2448 0 -- : -- : -- -- : -- : -- -- : -- : -- 2448 100 15.4M 100 15.4M 0 0 11.2M 0 0 : 00 : 01 0 : 00 : 01 -- : -- : -- 15.7M root @ localhost : ~ # sudo chmod +x /usr/local/bin/docker-compose root @ localhost : ~ # sudo ln -s /usr/local/bin/docker-compose /usr/bin/docker-compose |
Étape 7 Vérifier la version de Docker Compose
|
1 2 3 |
root @ localhost : ~ # docker-compose --version docker - compose version 1.24.1 , build 4667896b |
Félicitations - docker compose est installé avec succès sur votre machine virtuelle.
Étape 8 Créez le fichier docker-compose.yml
Allez dans le dossier /crunchify/prometheus.
|
1 2 3 |
root @ localhost : / crunchify # cd /crunchify/prometheus/ root @ localhost : / crunchify / prometheus # vi docker-compose.yml |
Contenu du fichier docker-compose.yml :
|
1 2 3 4 5 6 7 8 9 10 11 12 13 14 |
version : "3" services : prometheus : image : prom / prometheus : latest container_name : prometheus volumes : - / crunchify / prometheus / conf : / etc / prometheus - / crunchify / prometheus / data : / prometheus command : - '--config.file=/etc/prometheus/prometheus.yml' - '--storage.tsdb.path=/prometheus' ports : - "9090:9090" |
Étape 9 Installez Prometheus Start/Stop dans le cadre du contrôle du système.
Créer le fichier vi /etc/systemd/system/prometheus.service
Contenu du fichier prometheus.service :
|
1 2 3 4 5 6 7 8 9 10 11 12 13 14 15 16 17 |
[ Unit ] Description = Prometheus monitoring docker container After = docker . service BindsTo = docker . service [ Service ] Restart = always WorkingDirectory =/ crunchify / prometheus / # Ubuntu ExecStart =/ usr / bin / docker - compose up ExecStop =/ usr / bin / docker - compose down # CentOS #ExecStart=/usr/bin/docker-compose up #ExecStop=/usr/bin/docker-compose down [ Install ] WantedBy = multi - user . target |

Étape 10 Démarrer le service Prometheus
|
1 2 3 4 5 6 |
root @ localhost : / crunchify / prometheus / config # sudo systemctl daemon-reload root @ localhost : / crunchify / prometheus / config # sudo systemctl enable prometheus Created symlink / etc / systemd / system / multi - user . target . wants / prometheus . service → / etc / systemd / system / prometheus . service . root @ localhost : / crunchify / prometheus / config # sudo systemctl start prometheus |
Serveur Prometheus démarré sous Linux :
|
1 2 3 4 5 6 7 8 9 10 11 12 13 14 15 16 17 18 19 20 21 22 23 24 25 26 27 28 29 30 31 32 |
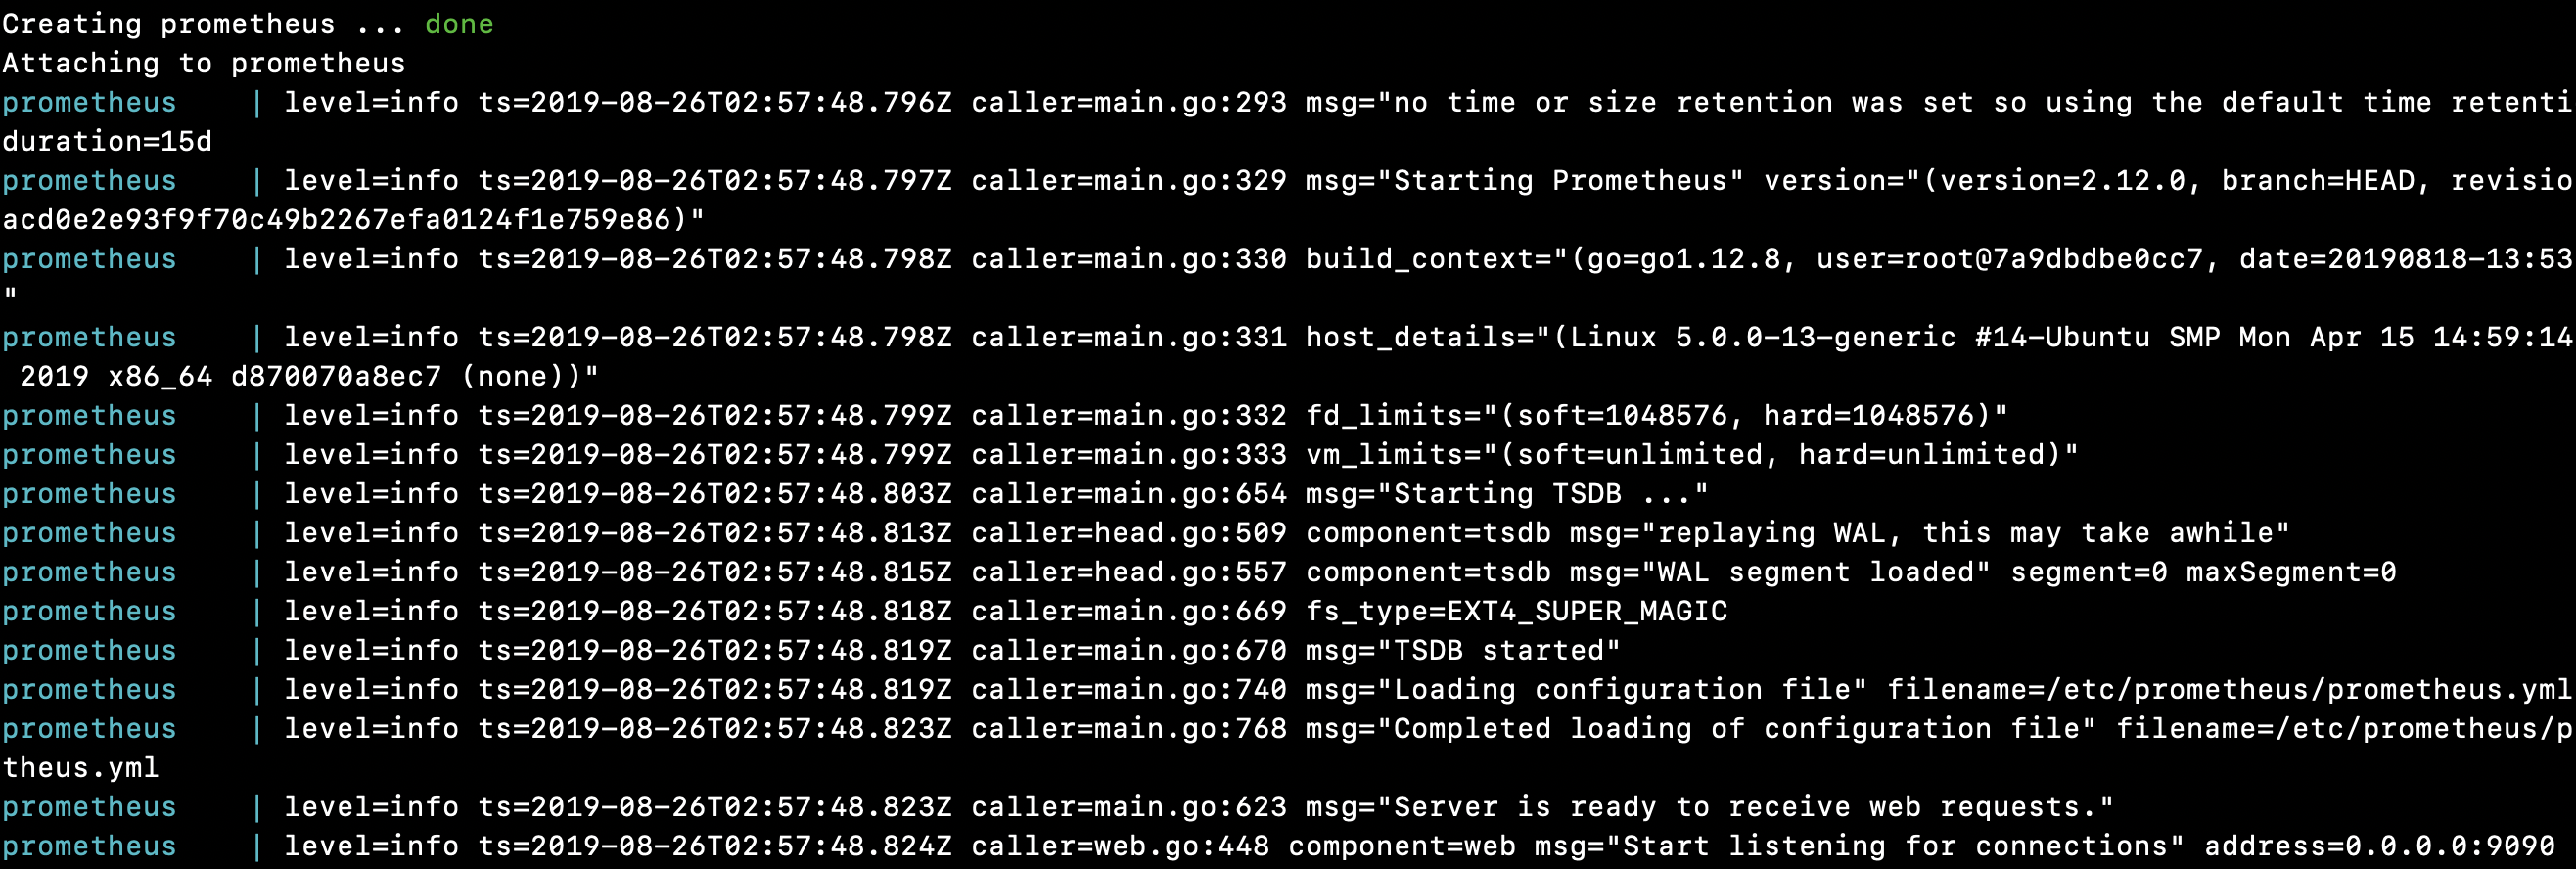
root @ localhost : / crunchify / prometheus # sudo systemctl start prometheus Creating network "prometheus_default" with the default driver Pulling prometheus ( prom / prometheus : latest ) . . . latest : Pulling from prom / prometheus 8e674ad76dce : Pull complete e77d2419d1c2 : Pull complete d7c0a2a2ca7e : Pull complete bd46de67c79d : Pull complete 35f6078df7e9 : Pull complete 8b3f04e26151 : Pull complete 9d234d9c8a77 : Pull complete 1a8a2a4f314d : Pull complete 62e28fd716ec : Pull complete Digest : sha256 : cd93b8711bb92eb9c437d74217311519e0a93bc55779aa664325dc83cd13cb32 Status : Downloaded newer image for prom / prometheus : latest Creating prometheus . . . done Attaching to prometheus prometheus | level = info ts = 2019 - 08 - 26T02 : 57 : 48.796Z caller = main . go : 293 msg = "no time or size retention was set so using the default time retention" duration = 15d prometheus | level = info ts = 2019 - 08 - 26T02 : 57 : 48.797Z caller = main . go : 329 msg = "Starting Prometheus" version = "(version=2.12.0, branch=HEAD, revision=43acd0e2e93f9f70c49b2267efa0124f1e759e86)" prometheus | level = info ts = 2019 - 08 - 26T02 : 57 : 48.798Z caller = main . go : 330 build_context = "(go=go1.12.8, user=root@7a9dbdbe0cc7, date=20190818-13:53:16)" prometheus | level = info ts = 2019 - 08 - 26T02 : 57 : 48.798Z caller = main . go : 331 host_details = "(Linux 5.0.0-13-generic #14-Ubuntu SMP Mon Apr 15 14:59:14 UTC 2019 x86_64 d870070a8ec7 (none))" prometheus | level = info ts = 2019 - 08 - 26T02 : 57 : 48.799Z caller = main . go : 332 fd_limits = "(soft=1048576, hard=1048576)" prometheus | level = info ts = 2019 - 08 - 26T02 : 57 : 48.799Z caller = main . go : 333 vm_limits = "(soft=unlimited, hard=unlimited)" prometheus | level = info ts = 2019 - 08 - 26T02 : 57 : 48.803Z caller = main . go : 654 msg = "Starting TSDB ..." prometheus | level = info ts = 2019 - 08 - 26T02 : 57 : 48.813Z caller = head . go : 509 component = tsdb msg = "replaying WAL, this may take awhile" prometheus | level = info ts = 2019 - 08 - 26T02 : 57 : 48.815Z caller = head . go : 557 component = tsdb msg = "WAL segment loaded" segment = 0 maxSegment = 0 prometheus | level = info ts = 2019 - 08 - 26T02 : 57 : 48.818Z caller = main . go : 669 fs_type = EXT4_SUPER_MAGIC prometheus | level = info ts = 2019 - 08 - 26T02 : 57 : 48.819Z caller = main . go : 670 msg = "TSDB started" prometheus | level = info ts = 2019 - 08 - 26T02 : 57 : 48.819Z caller = main . go : 740 msg = "Loading configuration file" filename =/ etc / prometheus / prometheus . yml prometheus | level = info ts = 2019 - 08 - 26T02 : 57 : 48.823Z caller = main . go : 768 msg = "Completed loading of configuration file" filename =/ etc / prometheus / prometheus . yml prometheus | level = info ts = 2019 - 08 - 26T02 : 57 : 48.823Z caller = main . go : 623 msg = "Server is ready to receive web requests." prometheus | level = info ts = 2019 - 08 - 26T02 : 57 : 48.824Z caller = web . go : 448 component = web msg = "Start listening for connections" address = 0.0.0.0 : 9090 |
Toutes nos félicitations!! Vous avez démarré avec succès Prometheus sur votre hôte.
Jouons avec le tableau de bord et l'interface utilisateur de Prometheus
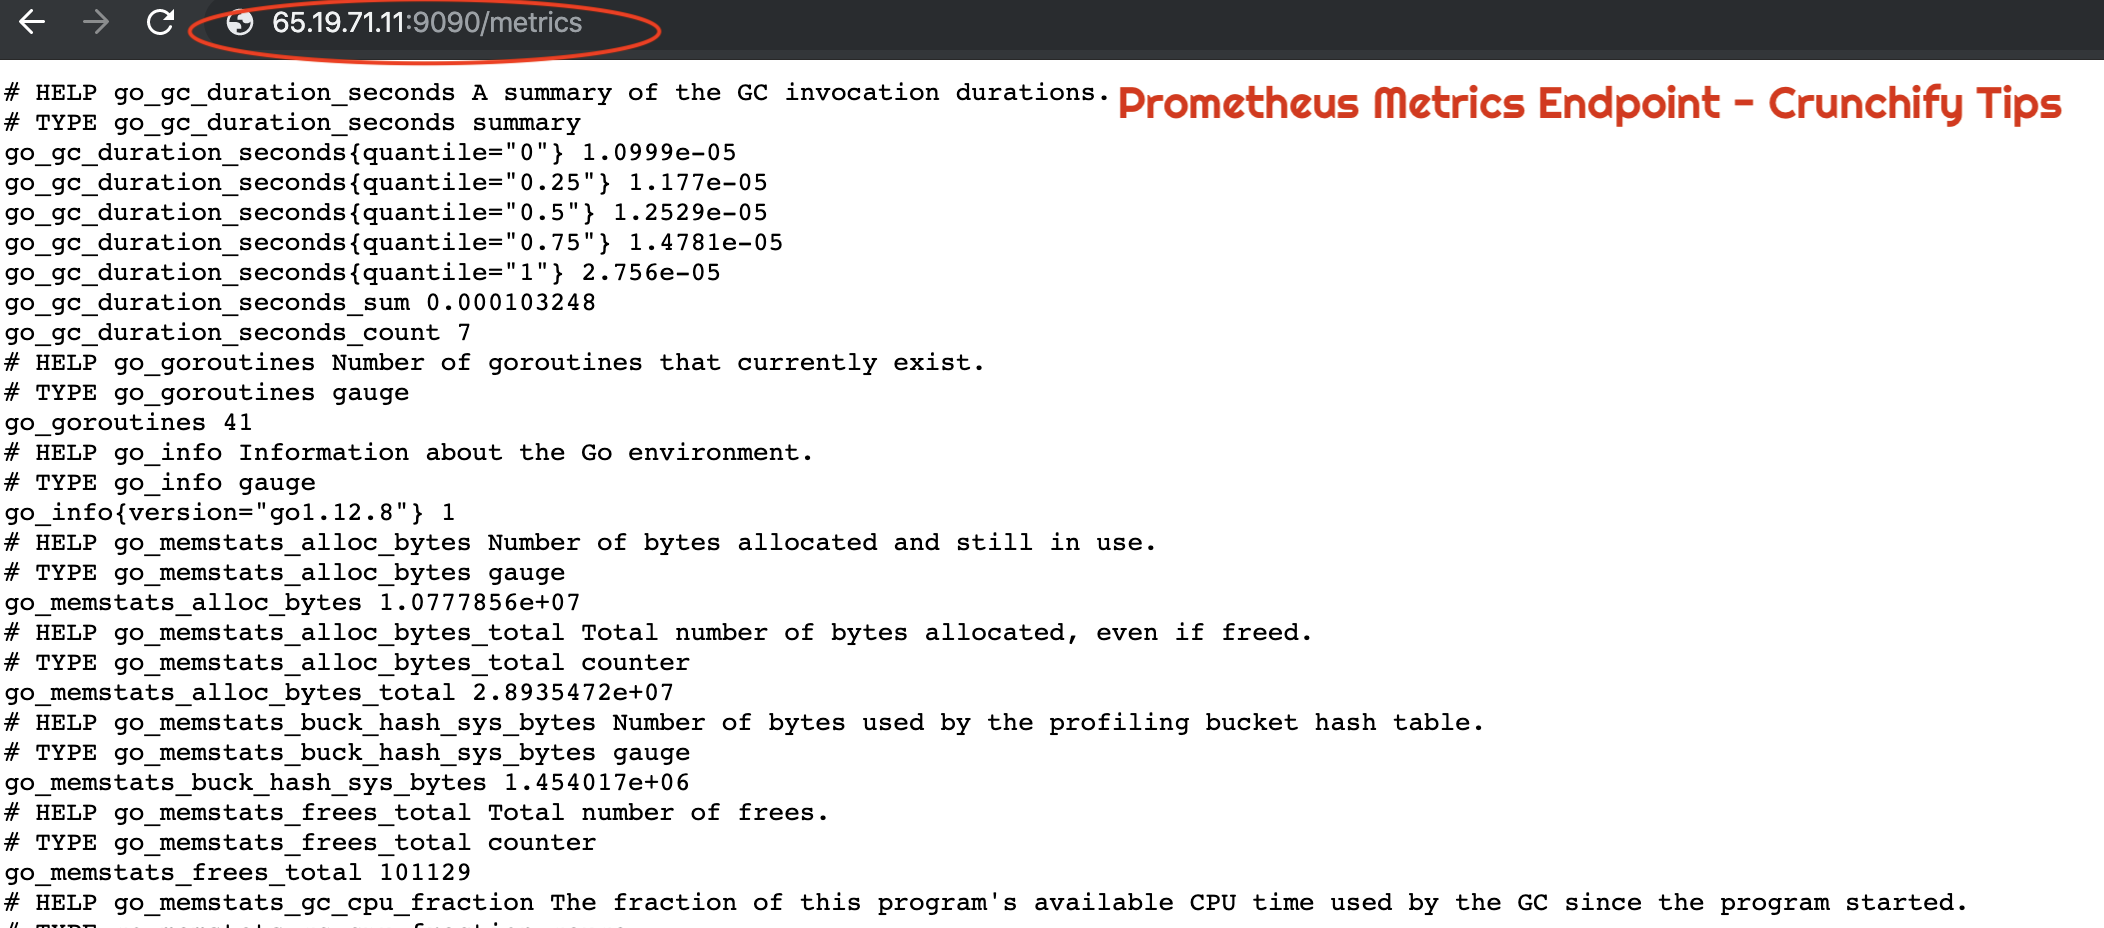
Comment vérifier si Prometheus fonctionne correctement ou non ?
|
1 |
URL : http : //65.19.71.11:9090/metrics |
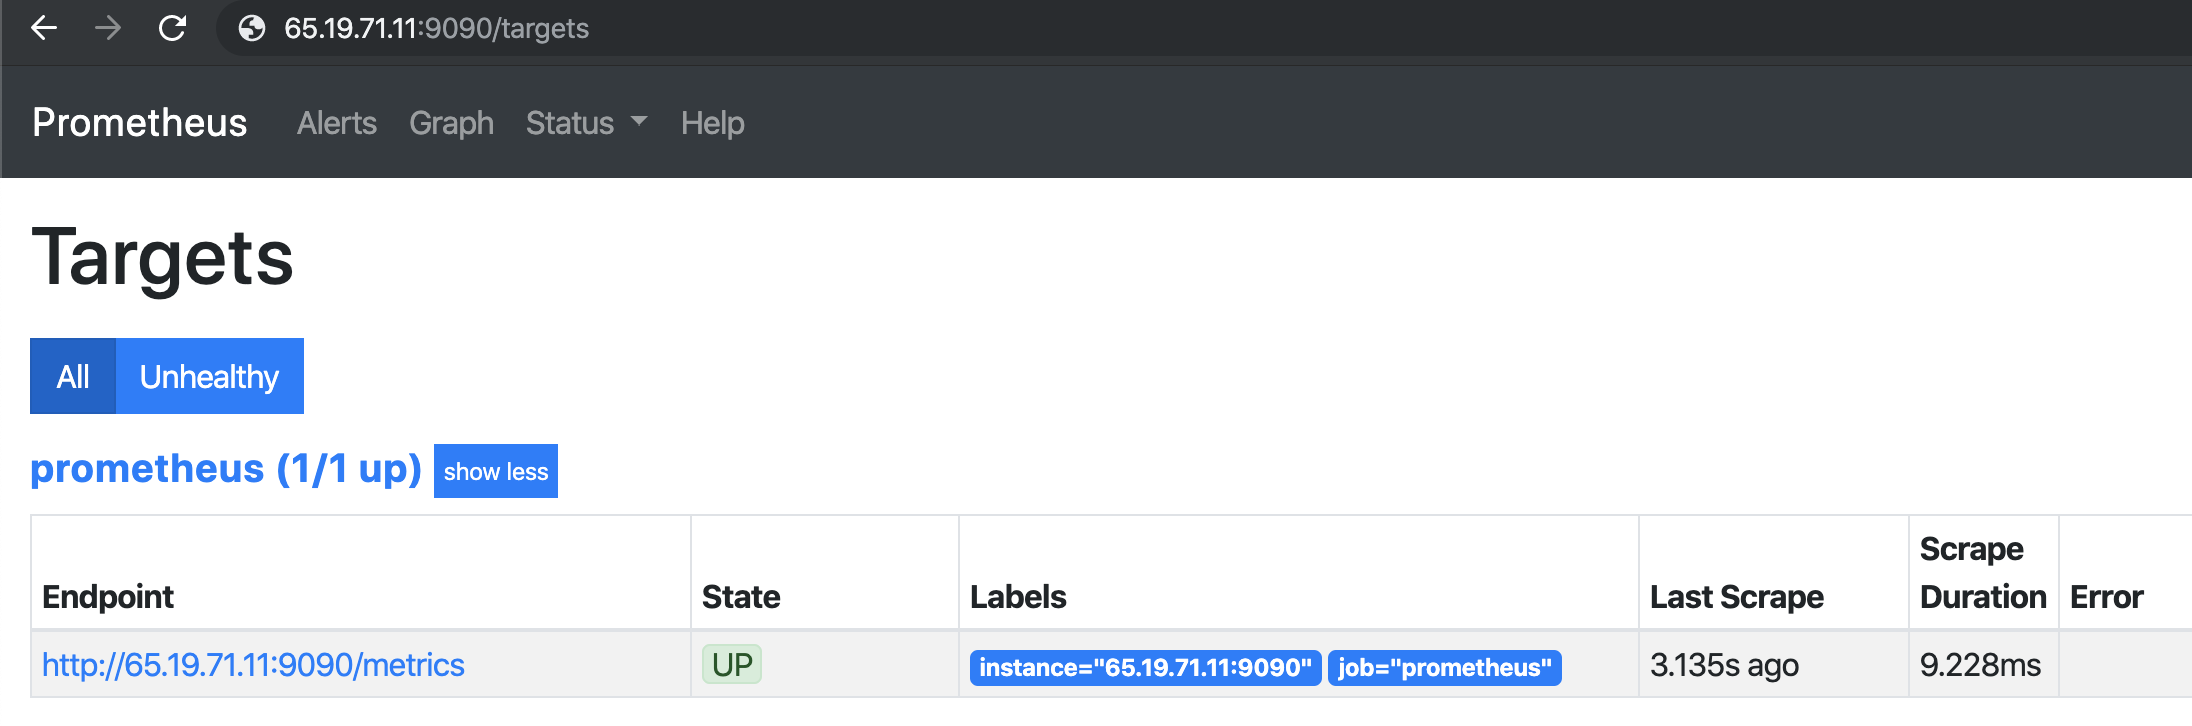
Comment vérifier le statut UP de l'hôte ou de la VM à l'aide de Prometheus ?
|
1 |
URL : http : //65.19.71.11:9090/targets |
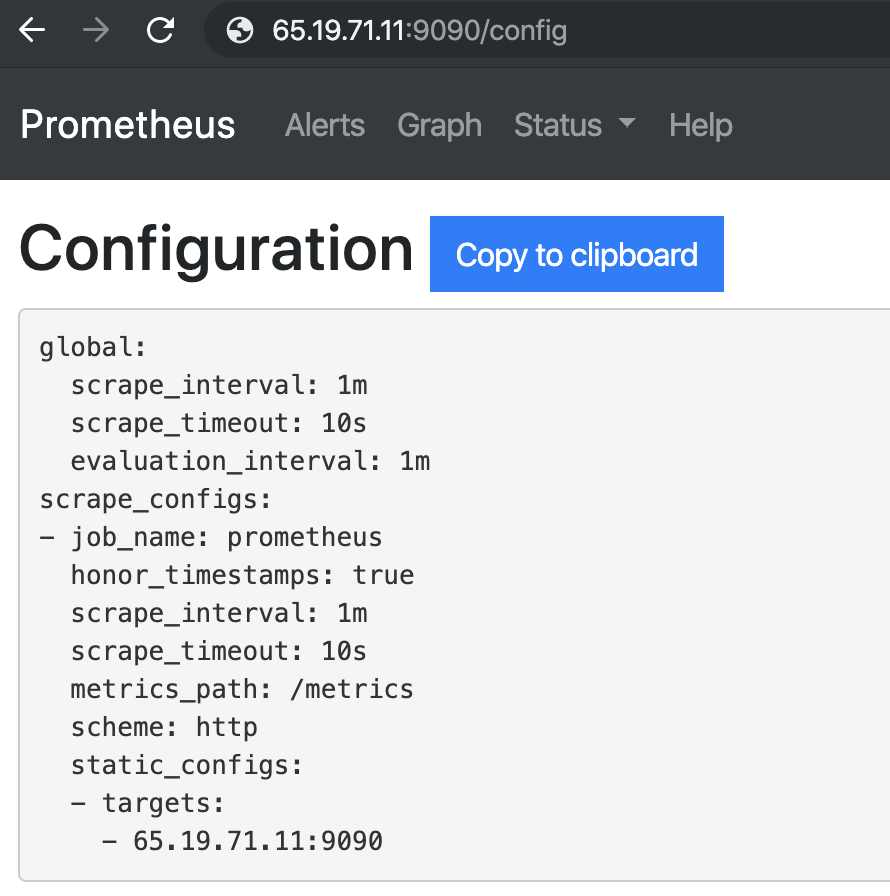
Comment vérifier la configuration de Prometheus sur le navigateur ?
Informations d'exécution Prometheus
|
1 |
URL : http : //65.19.71.11:9090/status |
| Disponibilité | 2019-08-26 03:07:24.244852166 +0000 UTC |
|---|---|
| Directeur de travail | /Prométhée |
| Rechargement de la configuration | Réussi |
| Dernier rechargement de configuration réussi | 2019-08-26 03:07:24 +0000 UTC |
| Morceaux de tête | 533 |
| Tête de série chronologique | 533 |
| Corruptions WAL | 0 |
| Goroutines | 36 |
| GOMAXPROCS | 1 |
| GOGC | |
| GODEBUG | |
| Rétention de stockage | 15j |
Informations sur la version de Prometheus
| Version | 2.12.0 |
|---|---|
| Révision | 43acd0e2e93f9f70c49b2267efa0124f1e759e86 |
| Branche | DIRIGER |
| BuildUser | root@7a9dbdbe0cc7 |
| Date de construction | 20190818-13:53:16 |
| GoVersion | aller1.12.8 |
Indicateurs de ligne de commande Prometheus :
|
1 |
URL : http : //65.19.71.11:9090/flags |
| alertmanager.notification-queue-capacity | 10000 |
|---|---|
| alertmanager.timeout | 10s |
| config.fichier | /etc/prometheus/prometheus.yml |
| log.format | logfmt |
| log.level | Info |
| requête.lookback-delta | 5m |
| requête.max-concurrence | 20 |
| query.max-échantillons | 50000000 |
| requête.timeout | 2m |
| règles.alerte.pour-période-de-grâce | 10m |
| règles.alerte.pour-tolérance-panne | 1h |
| rules.alert.resend-delay | 1m |
| stockage.remote.flush-date limite | 1m |
| storage.remote.read-concurrent-limit | dix |
| storage.remote.read-sample-limit | 50000000 |
| storage.tsdb.allow-overlapping-blocks | faux |
| stockage.tsdb.max-block-duration | 36h |
| stockage.tsdb.min-block-duration | 2h |
| stockage.tsdb.no-lockfile | faux |
| stockage.tsdb.path | /Prométhée |
| stockage.tsdb.rétention | 0s |
| stockage.tsdb.retention.size | 0B |
| stockage.tsdb.retention.time | 0s |
| stockage.tsdb.wal-compression | faux |
| stockage.tsdb.wal-segment-size | 0B |
| web.console.libraries | console_libraries |
| web.console.templates | consoles |
| web.cors.origine | .* |
| web.enable-admin-api | faux |
| cycle de vie web.enable | faux |
| web.external-url | |
| adresse-web.listen | 0.0.0.0:9090 |
| web.max-connexions | 512 |
| web.page-title | Serveur de traitement et de collecte de séries chronologiques Prometheus |
| web.read-timeout | 5m |
| préfixe web.route | / |
Et vous êtes prêt. Vous avez successfully installed Prometheus et vérifié toutes ses fonctionnalités.