
كيفية تثبيت وتكوين بروميثيوس على لينوكس؟ (Ubuntu و CentOS)
نشرت: 2019-08-26
ما هو بروميثيوس؟
بروميثيوس هو نظام مراقبة عالمي المستوى يأتي مع قاعدة بيانات السلاسل الزمنية بشكل افتراضي. إنه نظام مفتوح المصدر تم إنشاؤه في الأصل في عام 2012.
تستخدم أفضل 500 شركة في العالم شركة بروميثيوس لجمع المقاييس الخاصة ببنيتها التحتية وتطبيقاتها. يدعم Prometheus نموذج البيانات متعدد الأبعاد مع بيانات السلاسل الزمنية التي تم تحديدها بشكل أساسي على أنها مقاييس.
لا توجد متطلبات خاصة لتخزين البيانات حيث تستخدم بروميثيوس جزءًا من قاعدة Time Series DB (TSDB) من التثبيت الخاص بها.
سنقوم في هذا البرنامج التعليمي بتثبيت Prometheus على Linux Ubuntu و CentOS بخطوات فائقة البساطة.
هيا بنا نبدأ:
الخطوة 1: تحقق من إصدار Linux OS
الأمر: cat /etc/os-release
|
1 2 3 4 5 6 7 8 9 10 11 12 13 |
root @ localhost : ~ # cat /etc/os-release NAME = "Ubuntu" VERSION = "19.04 (Disco Dingo)" ID = ubuntu ID_LIKE = debian PRETTY_NAME = "Ubuntu 19.04" VERSION_ID = "19.04" HOME_URL = "https://www.ubuntu.com/" SUPPORT_URL = "https://help.ubuntu.com/" BUG_REPORT_URL = "https://bugs.launchpad.net/ubuntu/" PRIVACY_POLICY_URL = "https://www.ubuntu.com/legal/terms-and-policies/privacy-policy" VERSION_CODENAME = disco UBUNTU_CODENAME = disco |
تنطبق الخطوات التالية على Ubuntu Linux OS .
الخطوة 2: قم بإنشاء مجلد بيانات وتكوين بروميثيوس
الأوامر :
|
1 2 3 |
root @ localhost : ~ # sudo mkdir /crunchify/prometheus/conf root @ localhost : ~ # sudo mkdir /crunchify/prometheus/data |
دعنا نتحقق من كلا المجلدين:
|
1 2 3 4 5 6 7 8 9 |
root @ localhost : / crunchify / prometheus # pwd / crunchify / prometheus root @ localhost : / crunchify / prometheus # ls -ltra total 16 drwxr - xr - x 2 root root 4096 Aug 25 23 : 37 conf drwxr - xr - x 3 root root 4096 Aug 25 23 : 37 . . drwxr - xr - x 2 root root 4096 Aug 25 23 : 37 data drwxr - xr - x 4 root root 4096 Aug 25 23 : 37 . |
الخطوة 3 تغيير ملكية مجلد البيانات
هذا مطلوب لتجنب مشكلة الإذن في الخطوات اللاحقة.
|
1 |
root @ localhost : / crunchify / prometheus # sudo chown 65534:65534 /crunchify/prometheus/data/ |
الخطوة 4: قم بإنشاء ملف prometheus.yml
انتقل إلى المجلد /crunchify/prometheus/conf وأنشئ ملف prometheus.yml .
|
1 2 3 |
root @ localhost : / # cd /crunchify/prometheus/conf root @ localhost : / crunchify / prometheus / conf # vi prometheus.yml |
محتوى ملف prometheus.yml:
|
1 2 3 4 5 6 7 8 9 10 11 12 13 14 15 16 17 18 19 20 21 22 23 24 25 26 27 28 29 |
# my global config global : scrape_interval : 15s # Set the scrape interval to every 15 seconds. Default is every 1 minute. evaluation_interval : 15s # Evaluate rules every 15 seconds. The default is every 1 minute. # scrape_timeout is set to the global default (10s). # Alertmanager configuration alerting : alertmanagers : - static_configs : - targets : # - alertmanager:9093 # Load rules once and periodically evaluate them according to the global 'evaluation_interval'. rule_files : # - "first_rules.yml" # - "second_rules.yml" # A scrape configuration containing exactly one endpoint to scrape: # Here it's Prometheus itself. scrape_configs : # The job name is added as a label `job=<job_name>` to any time series scraped from this config. - job_name : 'prometheus' # metrics_path defaults to '/metrics' # scheme defaults to 'http'. static_configs : - targets : [ '65.19.71.11:9090' ] |
Note: في الملف أعلاه - استبدل IP بالمضيف / VM IP.
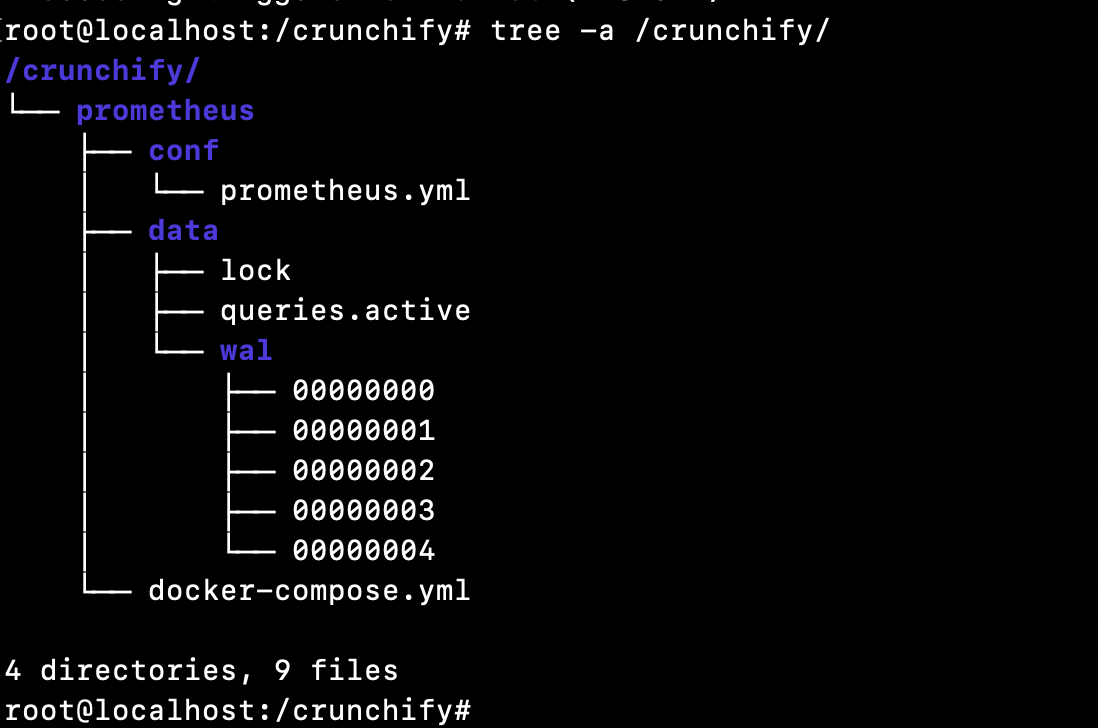
فيما يلي Directory structure لهذا البرنامج التعليمي:
الخطوة 5 تأكد من تثبيت Docker على الجهاز الظاهري الخاص بك.
كيف تتحقق مما إذا كان Docker مثبتًا أم لا؟
|
1 2 3 |
root @ localhost : ~ # docker Command 'docker' not found |
هذا يعني أن docker غير مثبت على مضيفك / VM. يرجى اتباع البرنامج التعليمي لتثبيت Docker بالكامل لتثبيت Docker على مضيفك / الجهاز الظاهري.
الخطوة 6 قم بتثبيت Docker Compose
Pre-requisiteهو تثبيت Docker أولاً قبل تنفيذ الخطوات أدناه. (الخطوة 5)
نفذ ثلاثة أوامر أدناه:
|
1 2 3 4 5 6 7 8 9 |
root @ localhost : ~ # sudo curl -L "https://github.com/docker/compose/releases/download/1.24.1/docker-compose-$(uname -s)-$(uname -m)" -o /usr/local/bin/docker-compose % Total % Received % Xferd Average Speed Time Time Time Current Dload Upload Total Spent Left Speed 100 617 0 617 0 0 2448 0 -- : -- : -- -- : -- : -- -- : -- : -- 2448 100 15.4M 100 15.4M 0 0 11.2M 0 0 : 00 : 01 0 : 00 : 01 -- : -- : -- 15.7M root @ localhost : ~ # sudo chmod +x /usr/local/bin/docker-compose root @ localhost : ~ # sudo ln -s /usr/local/bin/docker-compose /usr/bin/docker-compose |
الخطوة 7 تحقق من إصدار Docker Compose
|
1 2 3 |
root @ localhost : ~ # docker-compose --version docker - compose version 1.24.1 , build 4667896b |
تهانينا - تم تثبيت Docker compose بنجاح على الجهاز الظاهري.
الخطوة 8: قم بإنشاء ملف docker-compose.yml
انتقل إلى المجلد / crunchify / prometheus.
|
1 2 3 |
root @ localhost : / crunchify # cd /crunchify/prometheus/ root @ localhost : / crunchify / prometheus # vi docker-compose.yml |
محتوى ملف docker-compose.yml:
|
1 2 3 4 5 6 7 8 9 10 11 12 13 14 |
version : "3" services : prometheus : image : prom / prometheus : latest container_name : prometheus volumes : - / crunchify / prometheus / conf : / etc / prometheus - / crunchify / prometheus / data : / prometheus command : - '--config.file=/etc/prometheus/prometheus.yml' - '--storage.tsdb.path=/prometheus' ports : - "9090:9090" |

الخطوة-9 قم بتثبيت Prometheus Start / Stop كجزء من التحكم في النظام.
قم بإنشاء ملف vi /etc/systemd/system/prometheus.service
محتوى ملف prometheus.service:
|
1 2 3 4 5 6 7 8 9 10 11 12 13 14 15 16 17 |
[ Unit ] Description = Prometheus monitoring docker container After = docker . service BindsTo = docker . service [ Service ] Restart = always WorkingDirectory =/ crunchify / prometheus / # Ubuntu ExecStart =/ usr / bin / docker - compose up ExecStop =/ usr / bin / docker - compose down # CentOS #ExecStart=/usr/bin/docker-compose up #ExecStop=/usr/bin/docker-compose down [ Install ] WantedBy = multi - user . target |
خطوة 10 ابدأ خدمة بروميثيوس
|
1 2 3 4 5 6 |
root @ localhost : / crunchify / prometheus / config # sudo systemctl daemon-reload root @ localhost : / crunchify / prometheus / config # sudo systemctl enable prometheus Created symlink / etc / systemd / system / multi - user . target . wants / prometheus . service → / etc / systemd / system / prometheus . service . root @ localhost : / crunchify / prometheus / config # sudo systemctl start prometheus |
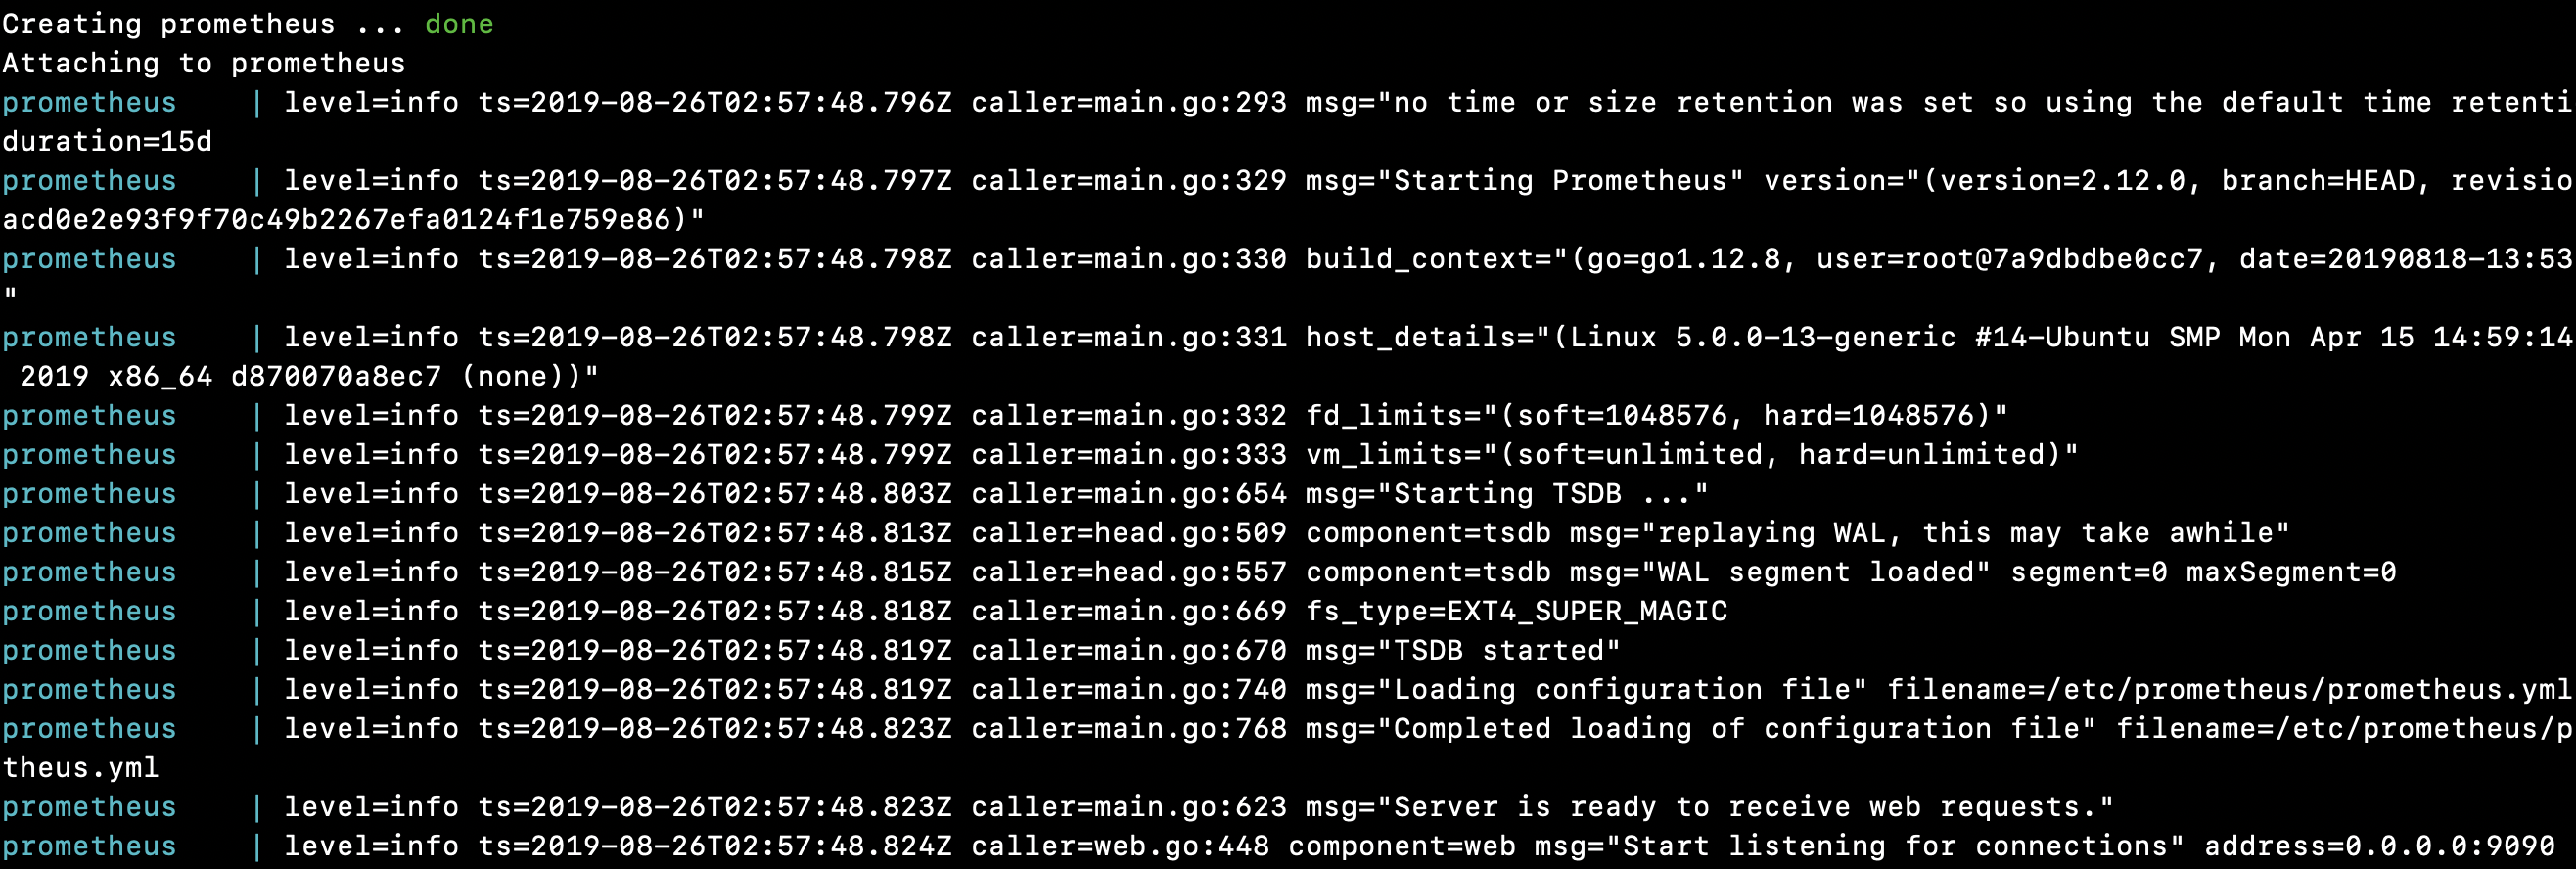
بدأ خادم Prometheus على Linux:
|
1 2 3 4 5 6 7 8 9 10 11 12 13 14 15 16 17 18 19 20 21 22 23 24 25 26 27 28 29 30 31 32 |
root @ localhost : / crunchify / prometheus # sudo systemctl start prometheus Creating network "prometheus_default" with the default driver Pulling prometheus ( prom / prometheus : latest ) . . . latest : Pulling from prom / prometheus 8e674ad76dce : Pull complete e77d2419d1c2 : Pull complete d7c0a2a2ca7e : Pull complete bd46de67c79d : Pull complete 35f6078df7e9 : Pull complete 8b3f04e26151 : Pull complete 9d234d9c8a77 : Pull complete 1a8a2a4f314d : Pull complete 62e28fd716ec : Pull complete Digest : sha256 : cd93b8711bb92eb9c437d74217311519e0a93bc55779aa664325dc83cd13cb32 Status : Downloaded newer image for prom / prometheus : latest Creating prometheus . . . done Attaching to prometheus prometheus | level = info ts = 2019 - 08 - 26T02 : 57 : 48.796Z caller = main . go : 293 msg = "no time or size retention was set so using the default time retention" duration = 15d prometheus | level = info ts = 2019 - 08 - 26T02 : 57 : 48.797Z caller = main . go : 329 msg = "Starting Prometheus" version = "(version=2.12.0, branch=HEAD, revision=43acd0e2e93f9f70c49b2267efa0124f1e759e86)" prometheus | level = info ts = 2019 - 08 - 26T02 : 57 : 48.798Z caller = main . go : 330 build_context = "(go=go1.12.8, user=root@7a9dbdbe0cc7, date=20190818-13:53:16)" prometheus | level = info ts = 2019 - 08 - 26T02 : 57 : 48.798Z caller = main . go : 331 host_details = "(Linux 5.0.0-13-generic #14-Ubuntu SMP Mon Apr 15 14:59:14 UTC 2019 x86_64 d870070a8ec7 (none))" prometheus | level = info ts = 2019 - 08 - 26T02 : 57 : 48.799Z caller = main . go : 332 fd_limits = "(soft=1048576, hard=1048576)" prometheus | level = info ts = 2019 - 08 - 26T02 : 57 : 48.799Z caller = main . go : 333 vm_limits = "(soft=unlimited, hard=unlimited)" prometheus | level = info ts = 2019 - 08 - 26T02 : 57 : 48.803Z caller = main . go : 654 msg = "Starting TSDB ..." prometheus | level = info ts = 2019 - 08 - 26T02 : 57 : 48.813Z caller = head . go : 509 component = tsdb msg = "replaying WAL, this may take awhile" prometheus | level = info ts = 2019 - 08 - 26T02 : 57 : 48.815Z caller = head . go : 557 component = tsdb msg = "WAL segment loaded" segment = 0 maxSegment = 0 prometheus | level = info ts = 2019 - 08 - 26T02 : 57 : 48.818Z caller = main . go : 669 fs_type = EXT4_SUPER_MAGIC prometheus | level = info ts = 2019 - 08 - 26T02 : 57 : 48.819Z caller = main . go : 670 msg = "TSDB started" prometheus | level = info ts = 2019 - 08 - 26T02 : 57 : 48.819Z caller = main . go : 740 msg = "Loading configuration file" filename =/ etc / prometheus / prometheus . yml prometheus | level = info ts = 2019 - 08 - 26T02 : 57 : 48.823Z caller = main . go : 768 msg = "Completed loading of configuration file" filename =/ etc / prometheus / prometheus . yml prometheus | level = info ts = 2019 - 08 - 26T02 : 57 : 48.823Z caller = main . go : 623 msg = "Server is ready to receive web requests." prometheus | level = info ts = 2019 - 08 - 26T02 : 57 : 48.824Z caller = web . go : 448 component = web msg = "Start listening for connections" address = 0.0.0.0 : 9090 |
تهانينا!! لقد نجحت في بدء تشغيل بروميثيوس على مضيفك.
هيا نلعب مع Prometheus Dashboard و UI
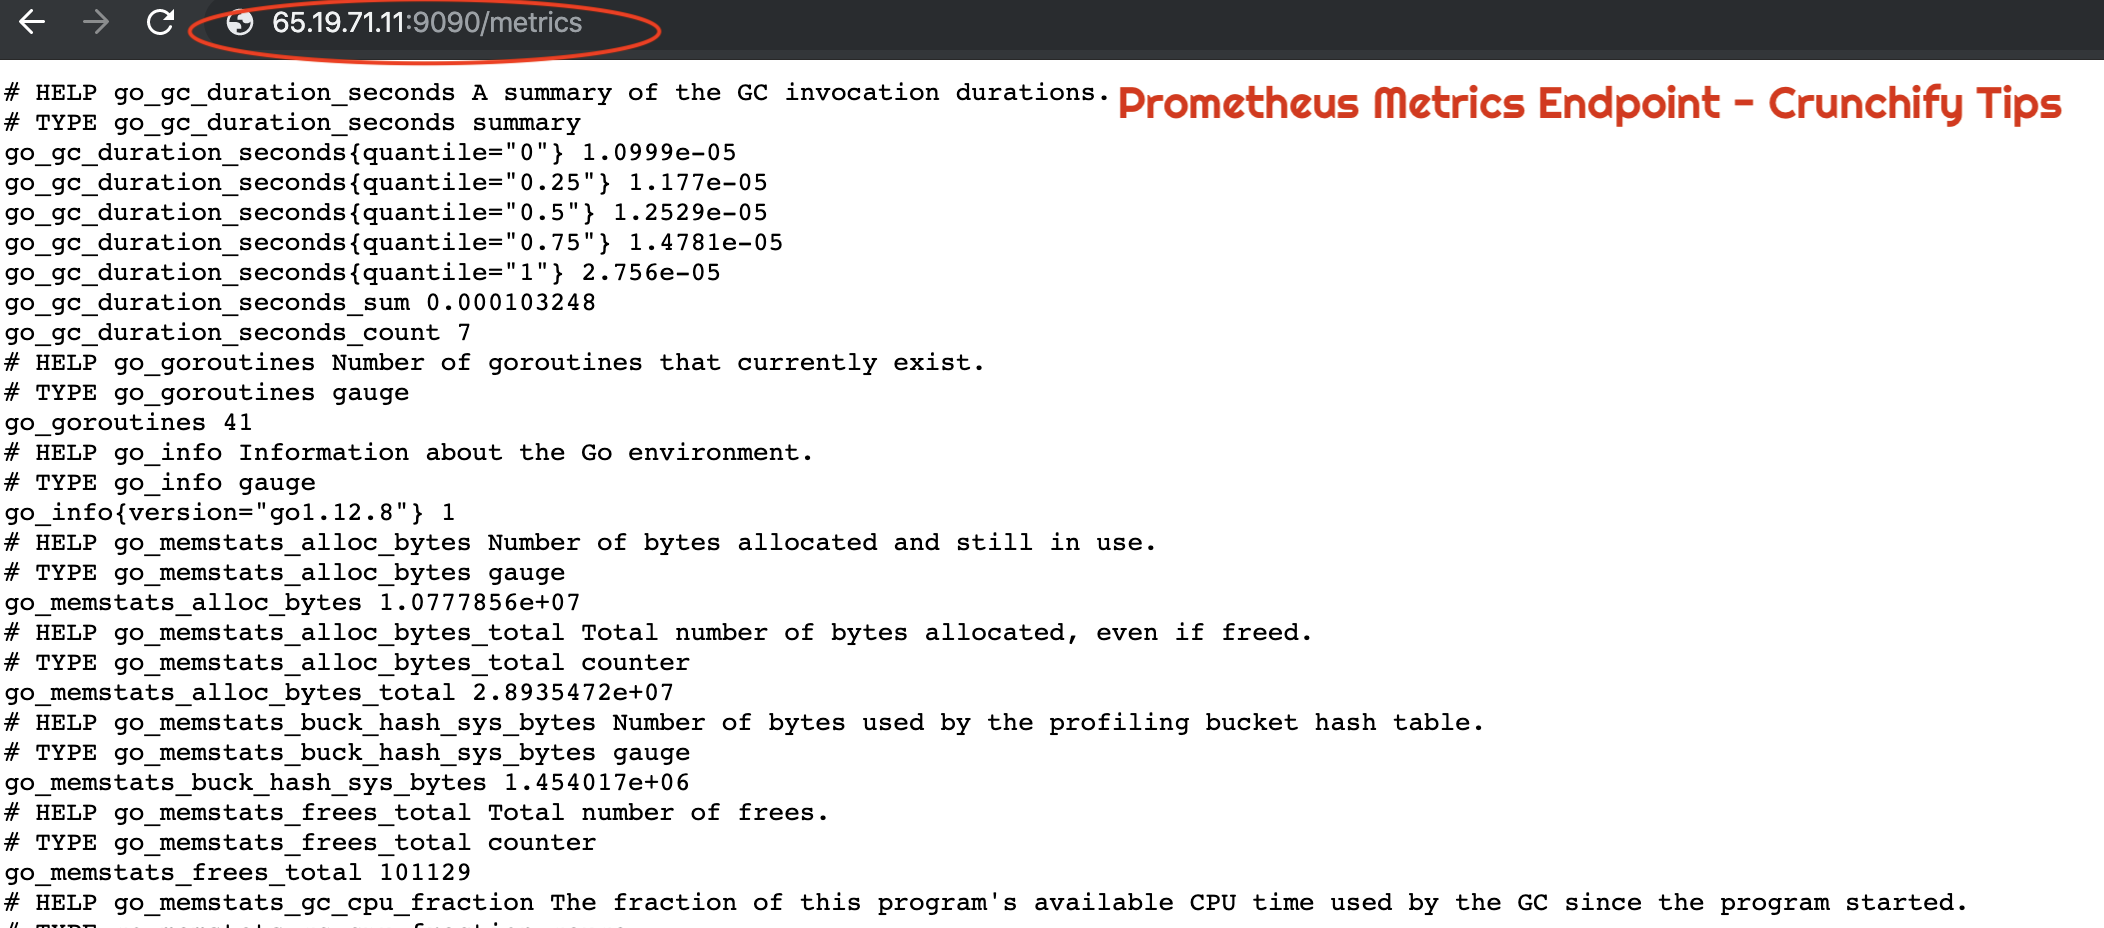
كيف تتحقق مما إذا كان بروميثيوس يعمل بشكل صحيح أم لا؟
|
1 |
URL : http : //65.19.71.11:9090/metrics |
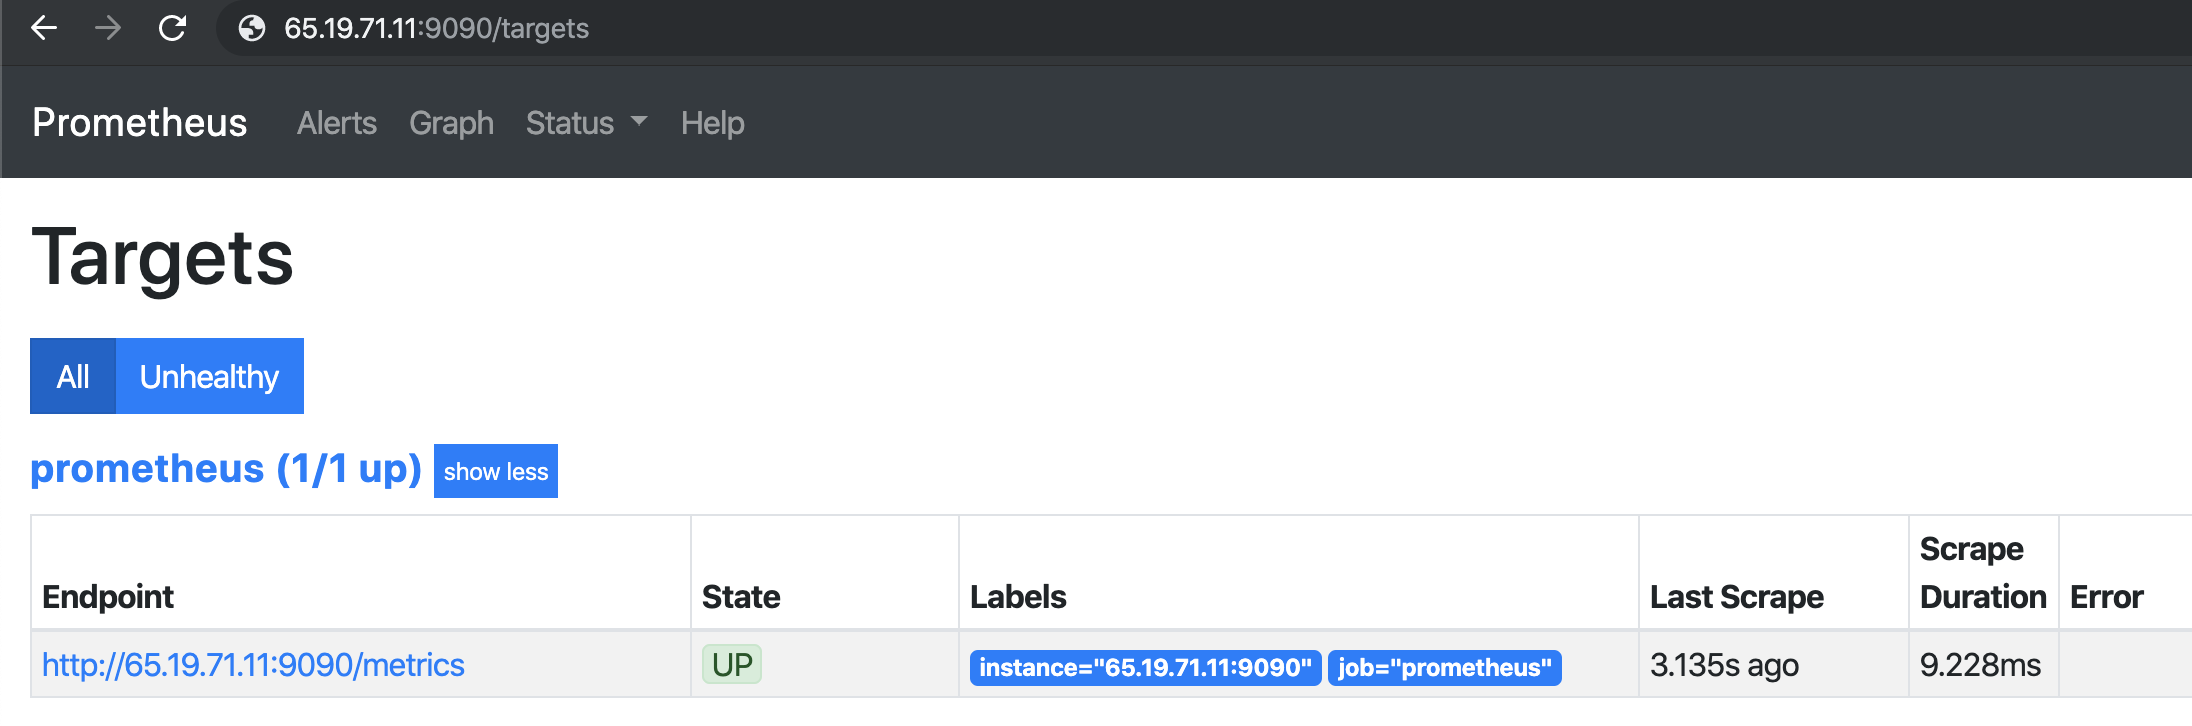
كيف تتحقق من حالة المضيف أو VM's UP باستخدام Prometheus؟
|
1 |
URL : http : //65.19.71.11:9090/targets |
كيفية التحقق من تكوين بروميثيوس على المتصفح؟
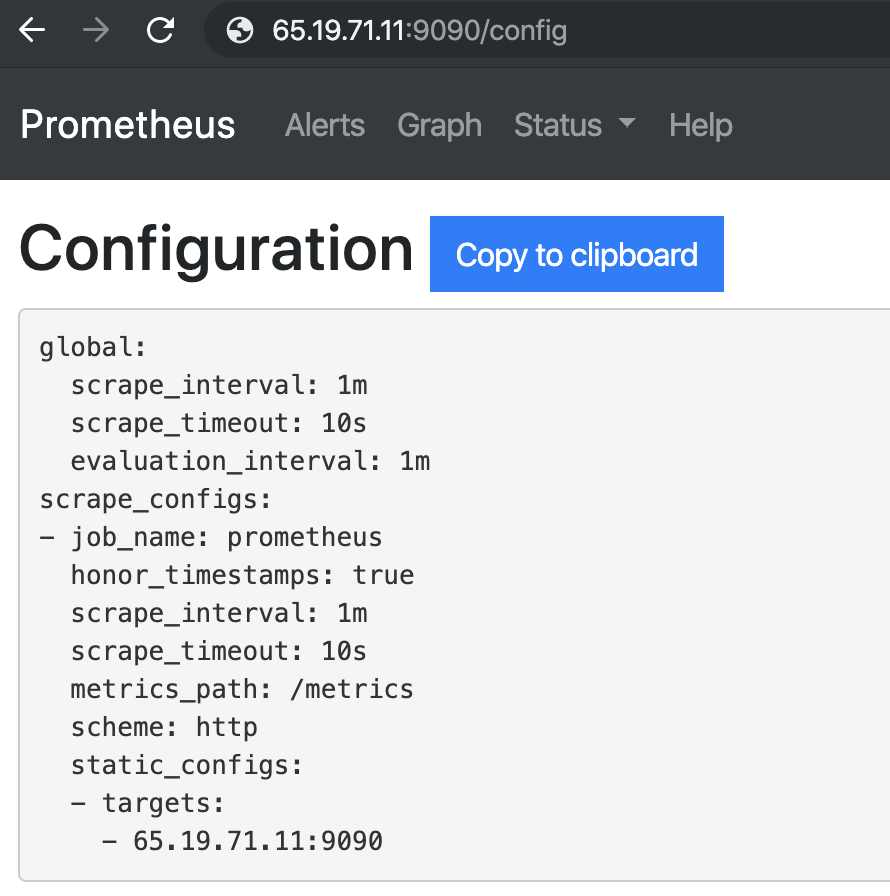
معلومات وقت تشغيل بروميثيوس
|
1 |
URL : http : //65.19.71.11:9090/status |
| مدة التشغيل | 26 أغسطس 2019 03: 07: 24.244852166 +0000 بالتوقيت العالمي المنسق |
|---|---|
| عمل اخراجي | / بروميثيوس |
| إعادة التكوين | ناجح |
| آخر إعادة تحميل التكوين بنجاح | 2019-08-26 03:07:24 +0000 بالتوقيت العالمي المنسق |
| قطع الرأس | 533 |
| سلسلة وقت الرأس | 533 |
| فساد WAL | 0 |
| جوروتين | 36 |
| GOMAXPROCS | 1 |
| GOGC | |
| جوديبوج | |
| الاحتفاظ بالتخزين | 15 د |
بروميثيوس بناء المعلومات
| الإصدار | 2.12.0 |
|---|---|
| مراجعة | 43acd0e2e93f9f70c49b2267efa0124f1e759e86 |
| فرع شجرة | رئيس |
| منشئ | جذر @ 7a9dbdbe0cc7 |
| تاريخ البناء | 20190818-13: 53:16 |
| GoVersion | اذهب 1.12.8 |
إشارات سطر أوامر بروميثيوس:
|
1 |
URL : http : //65.19.71.11:9090/flags |
| alertmanager.notification-queue-capacity | 10000 |
|---|---|
| alertmanager.timeout | 10 ثوانى |
| ملف التكوين | /etc/prometheus/prometheus.yml |
| تنسيق السجل | logfmt |
| تسجيل مستوى | معلومات |
| الاستعلام.لوك باك دلتا | 5 م |
| query.max- التزامن | 20 |
| query.max- عينات | 50000000 |
| الاستعلام مهلة | 2 م |
| قواعد التنبيه لفترة السماح | 10 م |
| القواعد. التنبيه. التسامح مع الانقطاع | 1 ساعة |
| القواعد.النذار.إعادة الإرسال | 1 م |
| التخزين.remote.flush- الموعد النهائي | 1 م |
| التخزين.remote.read-المتزامن الحد | 10 |
| Storage.remote.read-sample-limit | 50000000 |
| تخزين كتل متداخلة | خاطئة |
| Storage.tsdb.max-block-term | 36 ساعة |
| Storage.tsdb.min-block-duration | 2 ح |
| Storage.tsdb.no-lockfile | خاطئة |
| storage.tsdb.path | / بروميثيوس |
| التخزين | 0 ثانية |
| Storage.tsdb.retention.size | 0 ب |
| Storage.tsdb.retention.time | 0 ثانية |
| Storage.tsdb.wal- ضغط | خاطئة |
| Storage.tsdb.wal-part-part-size | 0 ب |
| web.console.libraries | مكتبات وحدة التحكم |
| web.console.templates | لوحات المفاتيح |
| web.cors.origin | . * |
| web.enable-admin-api | خاطئة |
| web.enable- دورة حياة | خاطئة |
| web.external-url | |
| web.listen- العنوان | 0.0.0.0:9090 |
| web.max- وصلات | 512 |
| عنوان صفحة الويب | خادم جمع ومعالجة السلاسل الزمنية بروميثيوس |
| web.read-timeout | 5 م |
| web.route- بادئة | / |
وأنت على أتم استعداد. لقد قمت successfully installed Prometheus وتحقق من جميع ميزاته.