
Linux에서 Prometheus를 설치 및 구성하는 방법은 무엇입니까? (우분투 및 CentOS)
게시 됨: 2019-08-26
프로메테우스란?
Prometheus는 세계 최고 수준의 모니터링 시스템이며 기본적으로 시계열 데이터베이스와 함께 제공됩니다. 원래 2012년에 구축된 오픈 소스 시스템입니다.
세계 상위 500대 기업은 인프라 및 애플리케이션에 대한 메트릭을 수집하기 위해 Prometheus를 사용하고 있습니다. Prometheus는 주로 메트릭으로 식별되는 시계열 데이터로 다차원 데이터 모델을 지원합니다.
Prometheus는 자체 설치의 TSDB( Time Series DB ) 부분을 사용하므로 특별한 데이터 저장 요구 사항은 없습니다.
이 튜토리얼에서는 매우 간단한 단계로 Linux Ubuntu 및 CentOS에 Prometheus를 설치합니다.
시작하자:
1단계 Linux OS 버전 확인
명령: cat /etc/os-release
|
1 2 3 4 5 6 7 8 9 10 11 12 13 |
root @ localhost : ~ # cat /etc/os-release NAME = "Ubuntu" VERSION = "19.04 (Disco Dingo)" ID = ubuntu ID_LIKE = debian PRETTY_NAME = "Ubuntu 19.04" VERSION_ID = "19.04" HOME_URL = "https://www.ubuntu.com/" SUPPORT_URL = "https://help.ubuntu.com/" BUG_REPORT_URL = "https://bugs.launchpad.net/ubuntu/" PRIVACY_POLICY_URL = "https://www.ubuntu.com/legal/terms-and-policies/privacy-policy" VERSION_CODENAME = disco UBUNTU_CODENAME = disco |
아래 단계는 Ubuntu Linux OS 에 적용됩니다.
2단계 Prometheus 데이터 및 구성 폴더 생성
명령 :
|
1 2 3 |
root @ localhost : ~ # sudo mkdir /crunchify/prometheus/conf root @ localhost : ~ # sudo mkdir /crunchify/prometheus/data |
두 폴더를 모두 확인하겠습니다.
|
1 2 3 4 5 6 7 8 9 |
root @ localhost : / crunchify / prometheus # pwd / crunchify / prometheus root @ localhost : / crunchify / prometheus # ls -ltra total 16 drwxr - xr - x 2 root root 4096 Aug 25 23 : 37 conf drwxr - xr - x 3 root root 4096 Aug 25 23 : 37 . . drwxr - xr - x 2 root root 4096 Aug 25 23 : 37 data drwxr - xr - x 4 root root 4096 Aug 25 23 : 37 . |
Step-3 데이터 폴더 소유권 변경
이는 이후 단계에서 권한 문제를 방지하기 위해 필요합니다.
|
1 |
root @ localhost : / crunchify / prometheus # sudo chown 65534:65534 /crunchify/prometheus/data/ |
4단계 prometheus.yml 파일 생성
/crunchify/prometheus/conf 폴더로 이동하여 prometheus.yml 파일을 만듭니다.
|
1 2 3 |
root @ localhost : / # cd /crunchify/prometheus/conf root @ localhost : / crunchify / prometheus / conf # vi prometheus.yml |
prometheus.yml 파일 내용:
|
1 2 3 4 5 6 7 8 9 10 11 12 13 14 15 16 17 18 19 20 21 22 23 24 25 26 27 28 29 |
# my global config global : scrape_interval : 15s # Set the scrape interval to every 15 seconds. Default is every 1 minute. evaluation_interval : 15s # Evaluate rules every 15 seconds. The default is every 1 minute. # scrape_timeout is set to the global default (10s). # Alertmanager configuration alerting : alertmanagers : - static_configs : - targets : # - alertmanager:9093 # Load rules once and periodically evaluate them according to the global 'evaluation_interval'. rule_files : # - "first_rules.yml" # - "second_rules.yml" # A scrape configuration containing exactly one endpoint to scrape: # Here it's Prometheus itself. scrape_configs : # The job name is added as a label `job=<job_name>` to any time series scraped from this config. - job_name : 'prometheus' # metrics_path defaults to '/metrics' # scheme defaults to 'http'. static_configs : - targets : [ '65.19.71.11:9090' ] |
Note: 위 파일에서 IP를 호스트/VM IP로 바꾸십시오.
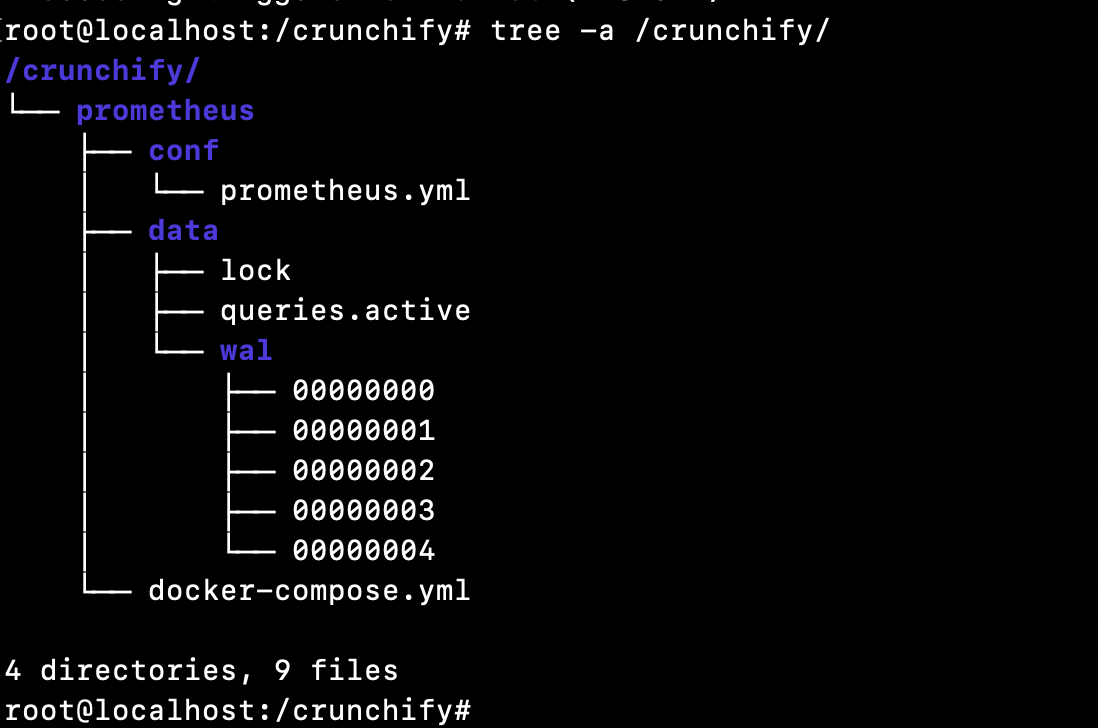
이 튜토리얼의 Directory structure 는 다음과 같습니다.
5단계 VM에 Docker를 설치했는지 확인합니다.
Docker가 설치되어 있는지 확인하는 방법은 무엇입니까?
|
1 2 3 |
root @ localhost : ~ # docker Command 'docker' not found |
즉, 호스트/VM에 도커가 설치되어 있지 않습니다. 호스트/VM에 Docker를 설치하려면 Docker 설치 자습서를 완전히 따르십시오.
6단계 Docker Compose 설치
Pre-requisite은 아래 단계를 실행하기 전에 먼저 Docker를 설치하는 것입니다. (5단계)
아래 세 가지 명령을 실행합니다.
|
1 2 3 4 5 6 7 8 9 |
root @ localhost : ~ # sudo curl -L "https://github.com/docker/compose/releases/download/1.24.1/docker-compose-$(uname -s)-$(uname -m)" -o /usr/local/bin/docker-compose % Total % Received % Xferd Average Speed Time Time Time Current Dload Upload Total Spent Left Speed 100 617 0 617 0 0 2448 0 -- : -- : -- -- : -- : -- -- : -- : -- 2448 100 15.4M 100 15.4M 0 0 11.2M 0 0 : 00 : 01 0 : 00 : 01 -- : -- : -- 15.7M root @ localhost : ~ # sudo chmod +x /usr/local/bin/docker-compose root @ localhost : ~ # sudo ln -s /usr/local/bin/docker-compose /usr/bin/docker-compose |
7단계 Docker Compose 버전 확인
|
1 2 3 |
root @ localhost : ~ # docker-compose --version docker - compose version 1.24.1 , build 4667896b |
축하합니다. Docker compose가 VM에 성공적으로 설치되었습니다.
8단계 docker-compose.yml 파일 생성
/crunchify/prometheus 폴더로 이동합니다.
|
1 2 3 |
root @ localhost : / crunchify # cd /crunchify/prometheus/ root @ localhost : / crunchify / prometheus # vi docker-compose.yml |
docker-compose.yml 파일 내용:
|
1 2 3 4 5 6 7 8 9 10 11 12 13 14 |
version : "3" services : prometheus : image : prom / prometheus : latest container_name : prometheus volumes : - / crunchify / prometheus / conf : / etc / prometheus - / crunchify / prometheus / data : / prometheus command : - '--config.file=/etc/prometheus/prometheus.yml' - '--storage.tsdb.path=/prometheus' ports : - "9090:9090" |
9단계 시스템 제어의 일부로 Prometheus Start/Stop을 설치합니다.
vi /etc/systemd/system/prometheus.service 파일 생성
prometheus.service 파일 내용:
|
1 2 3 4 5 6 7 8 9 10 11 12 13 14 15 16 17 |
[ Unit ] Description = Prometheus monitoring docker container After = docker . service BindsTo = docker . service [ Service ] Restart = always WorkingDirectory =/ crunchify / prometheus / # Ubuntu ExecStart =/ usr / bin / docker - compose up ExecStop =/ usr / bin / docker - compose down # CentOS #ExecStart=/usr/bin/docker-compose up #ExecStop=/usr/bin/docker-compose down [ Install ] WantedBy = multi - user . target |

Step-10 Prometheus 서비스 시작
|
1 2 3 4 5 6 |
root @ localhost : / crunchify / prometheus / config # sudo systemctl daemon-reload root @ localhost : / crunchify / prometheus / config # sudo systemctl enable prometheus Created symlink / etc / systemd / system / multi - user . target . wants / prometheus . service → / etc / systemd / system / prometheus . service . root @ localhost : / crunchify / prometheus / config # sudo systemctl start prometheus |
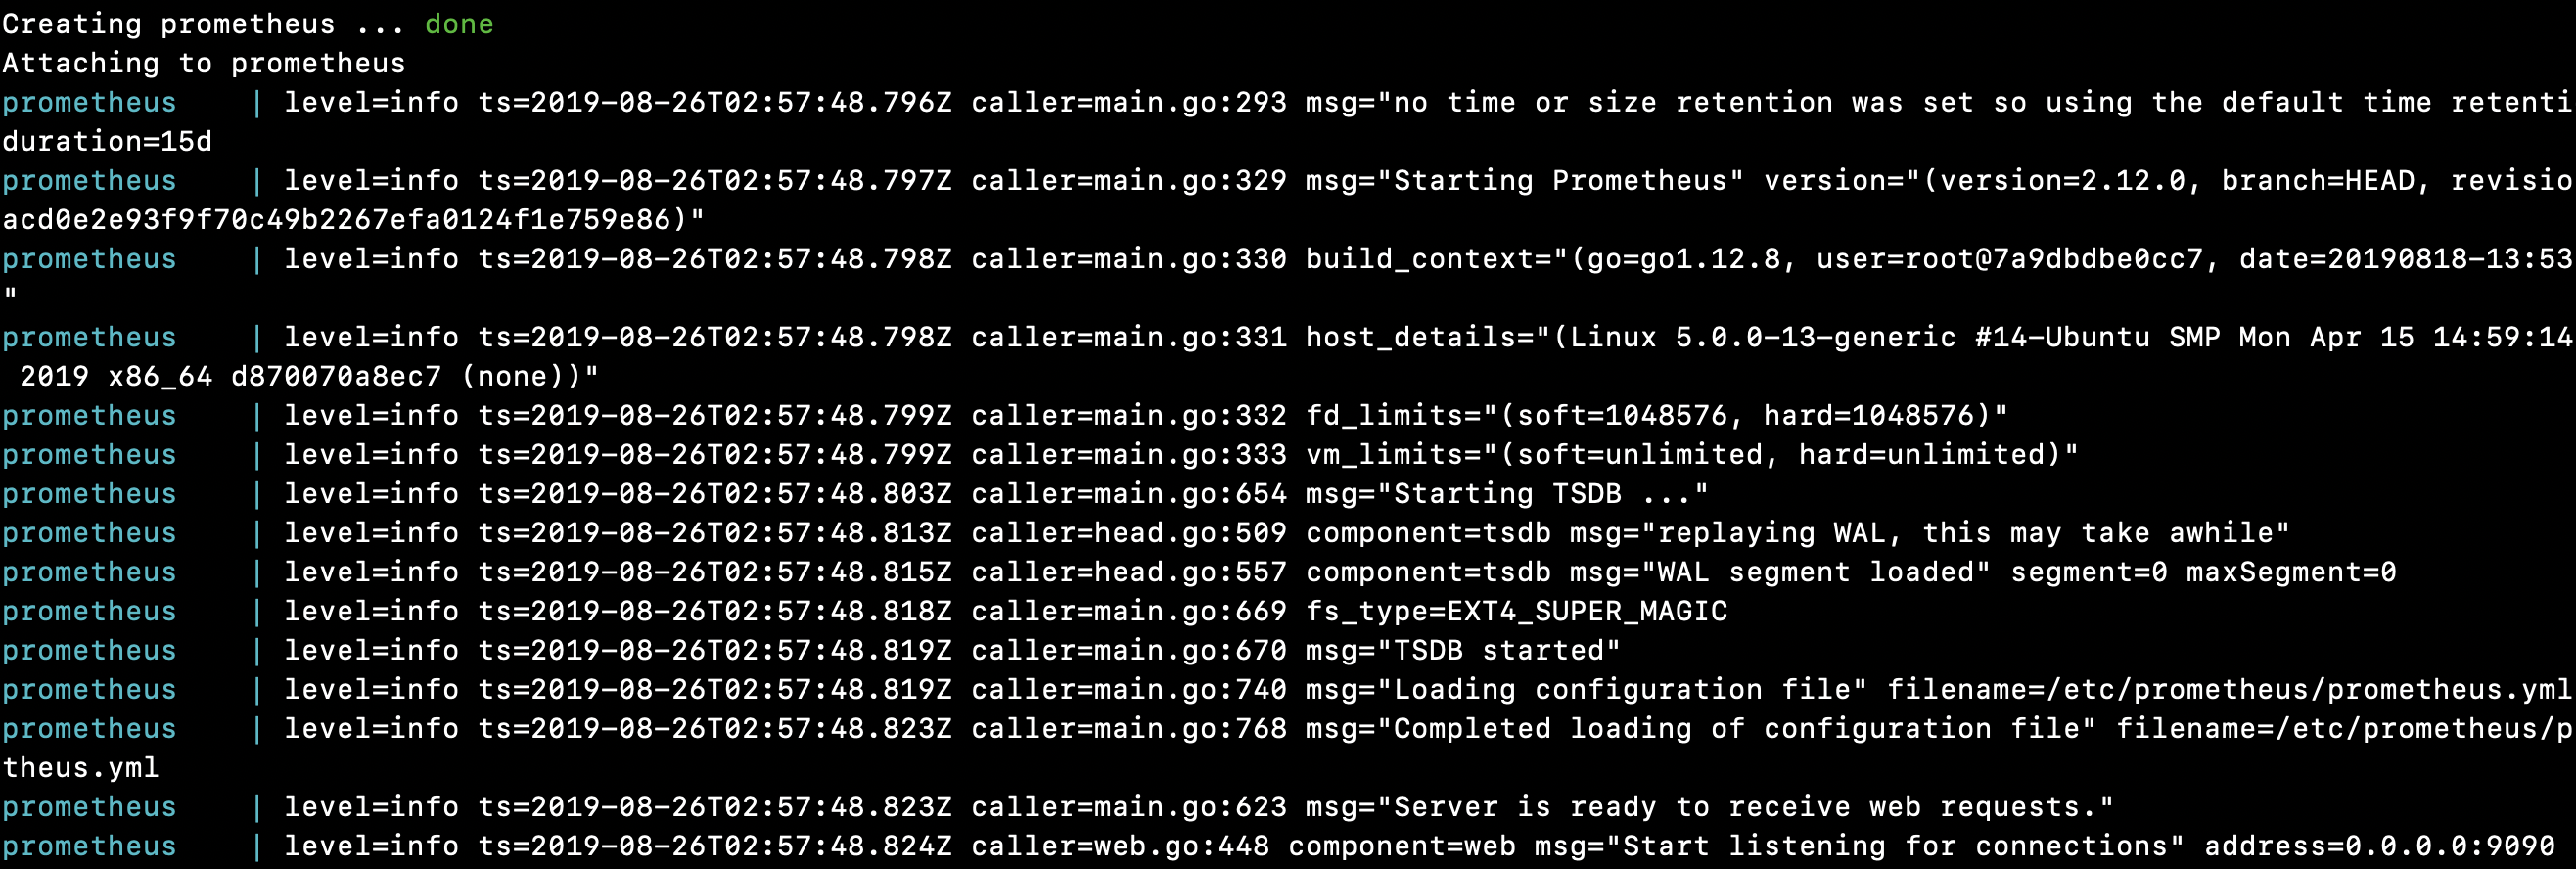
Linux에서 시작된 Prometheus 서버:
|
1 2 3 4 5 6 7 8 9 10 11 12 13 14 15 16 17 18 19 20 21 22 23 24 25 26 27 28 29 30 31 32 |
root @ localhost : / crunchify / prometheus # sudo systemctl start prometheus Creating network "prometheus_default" with the default driver Pulling prometheus ( prom / prometheus : latest ) . . . latest : Pulling from prom / prometheus 8e674ad76dce : Pull complete e77d2419d1c2 : Pull complete d7c0a2a2ca7e : Pull complete bd46de67c79d : Pull complete 35f6078df7e9 : Pull complete 8b3f04e26151 : Pull complete 9d234d9c8a77 : Pull complete 1a8a2a4f314d : Pull complete 62e28fd716ec : Pull complete Digest : sha256 : cd93b8711bb92eb9c437d74217311519e0a93bc55779aa664325dc83cd13cb32 Status : Downloaded newer image for prom / prometheus : latest Creating prometheus . . . done Attaching to prometheus prometheus | level = info ts = 2019 - 08 - 26T02 : 57 : 48.796Z caller = main . go : 293 msg = "no time or size retention was set so using the default time retention" duration = 15d prometheus | level = info ts = 2019 - 08 - 26T02 : 57 : 48.797Z caller = main . go : 329 msg = "Starting Prometheus" version = "(version=2.12.0, branch=HEAD, revision=43acd0e2e93f9f70c49b2267efa0124f1e759e86)" prometheus | level = info ts = 2019 - 08 - 26T02 : 57 : 48.798Z caller = main . go : 330 build_context = "(go=go1.12.8, user=root@7a9dbdbe0cc7, date=20190818-13:53:16)" prometheus | level = info ts = 2019 - 08 - 26T02 : 57 : 48.798Z caller = main . go : 331 host_details = "(Linux 5.0.0-13-generic #14-Ubuntu SMP Mon Apr 15 14:59:14 UTC 2019 x86_64 d870070a8ec7 (none))" prometheus | level = info ts = 2019 - 08 - 26T02 : 57 : 48.799Z caller = main . go : 332 fd_limits = "(soft=1048576, hard=1048576)" prometheus | level = info ts = 2019 - 08 - 26T02 : 57 : 48.799Z caller = main . go : 333 vm_limits = "(soft=unlimited, hard=unlimited)" prometheus | level = info ts = 2019 - 08 - 26T02 : 57 : 48.803Z caller = main . go : 654 msg = "Starting TSDB ..." prometheus | level = info ts = 2019 - 08 - 26T02 : 57 : 48.813Z caller = head . go : 509 component = tsdb msg = "replaying WAL, this may take awhile" prometheus | level = info ts = 2019 - 08 - 26T02 : 57 : 48.815Z caller = head . go : 557 component = tsdb msg = "WAL segment loaded" segment = 0 maxSegment = 0 prometheus | level = info ts = 2019 - 08 - 26T02 : 57 : 48.818Z caller = main . go : 669 fs_type = EXT4_SUPER_MAGIC prometheus | level = info ts = 2019 - 08 - 26T02 : 57 : 48.819Z caller = main . go : 670 msg = "TSDB started" prometheus | level = info ts = 2019 - 08 - 26T02 : 57 : 48.819Z caller = main . go : 740 msg = "Loading configuration file" filename =/ etc / prometheus / prometheus . yml prometheus | level = info ts = 2019 - 08 - 26T02 : 57 : 48.823Z caller = main . go : 768 msg = "Completed loading of configuration file" filename =/ etc / prometheus / prometheus . yml prometheus | level = info ts = 2019 - 08 - 26T02 : 57 : 48.823Z caller = main . go : 623 msg = "Server is ready to receive web requests." prometheus | level = info ts = 2019 - 08 - 26T02 : 57 : 48.824Z caller = web . go : 448 component = web msg = "Start listening for connections" address = 0.0.0.0 : 9090 |
축하 해요!! 호스트에서 Prometheus를 성공적으로 시작했습니다.
Prometheus 대시보드와 UI를 가지고 놀자
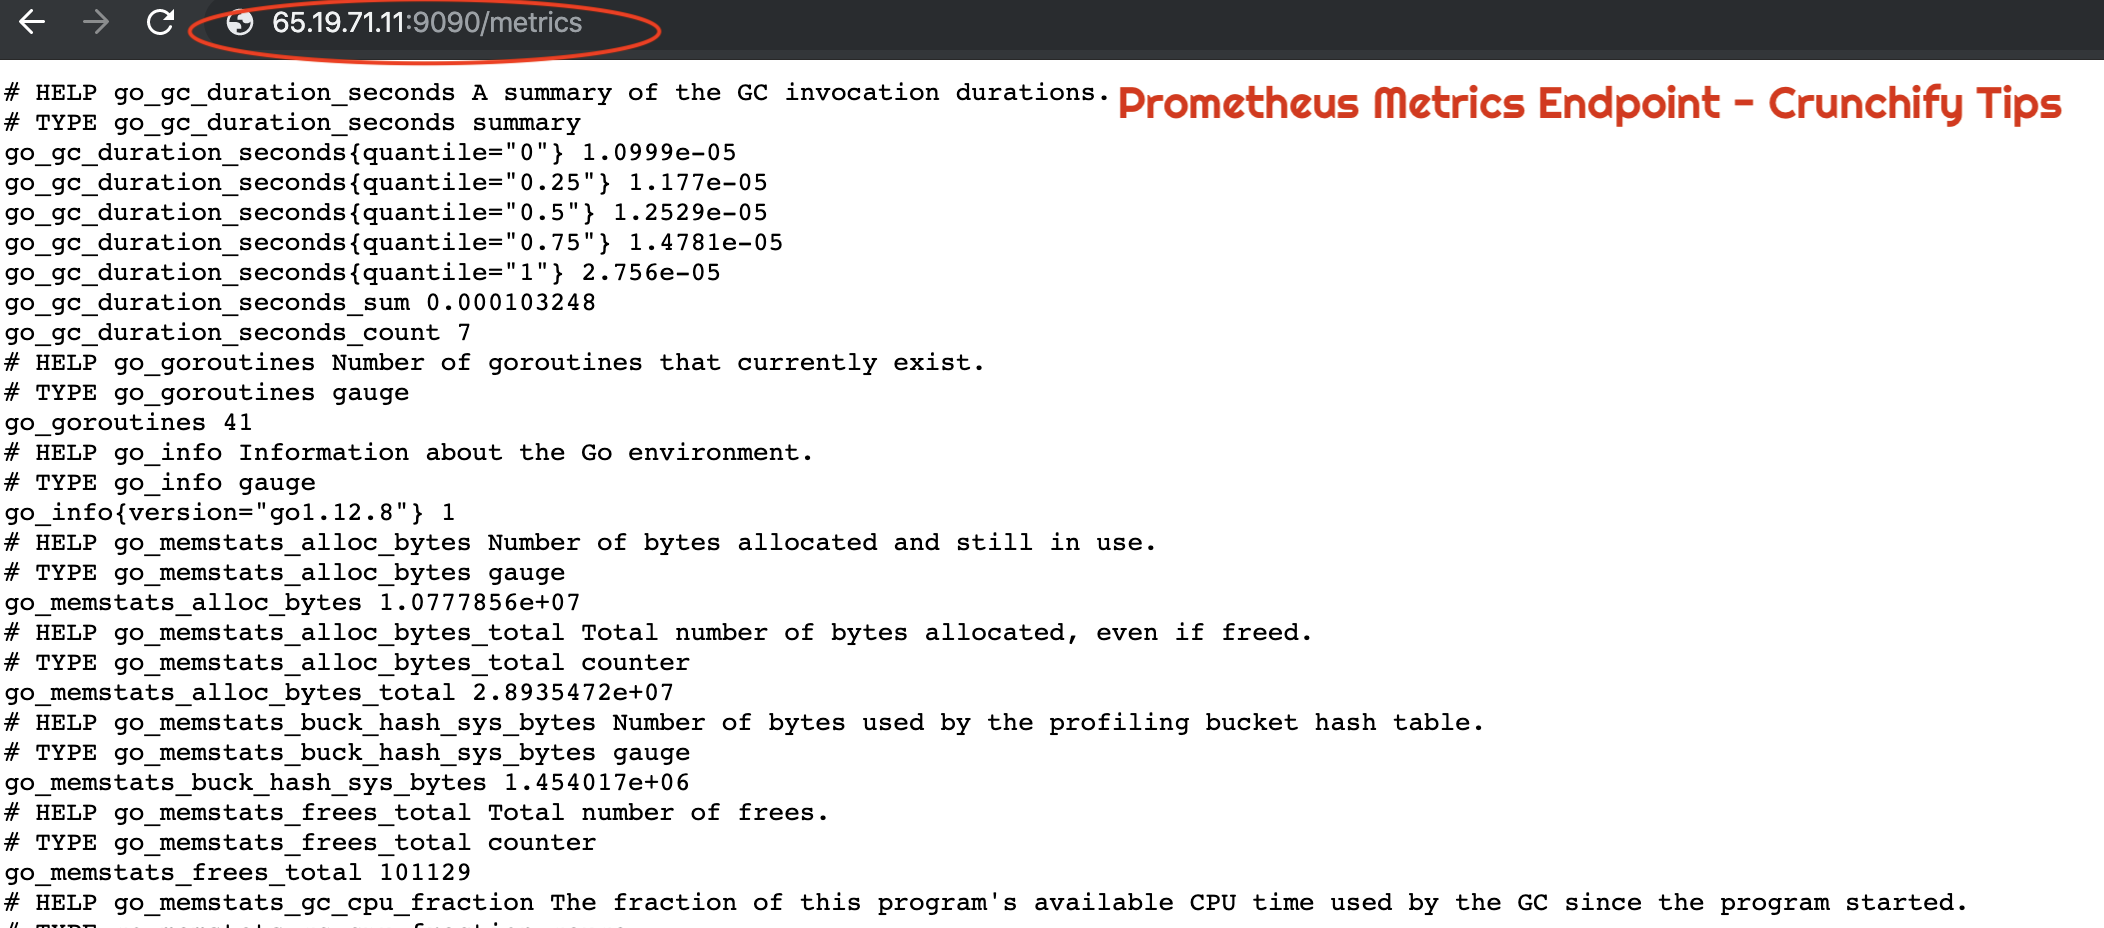
Prometheus가 올바르게 실행되고 있는지 확인하는 방법은 무엇입니까?
|
1 |
URL : http : //65.19.71.11:9090/metrics |
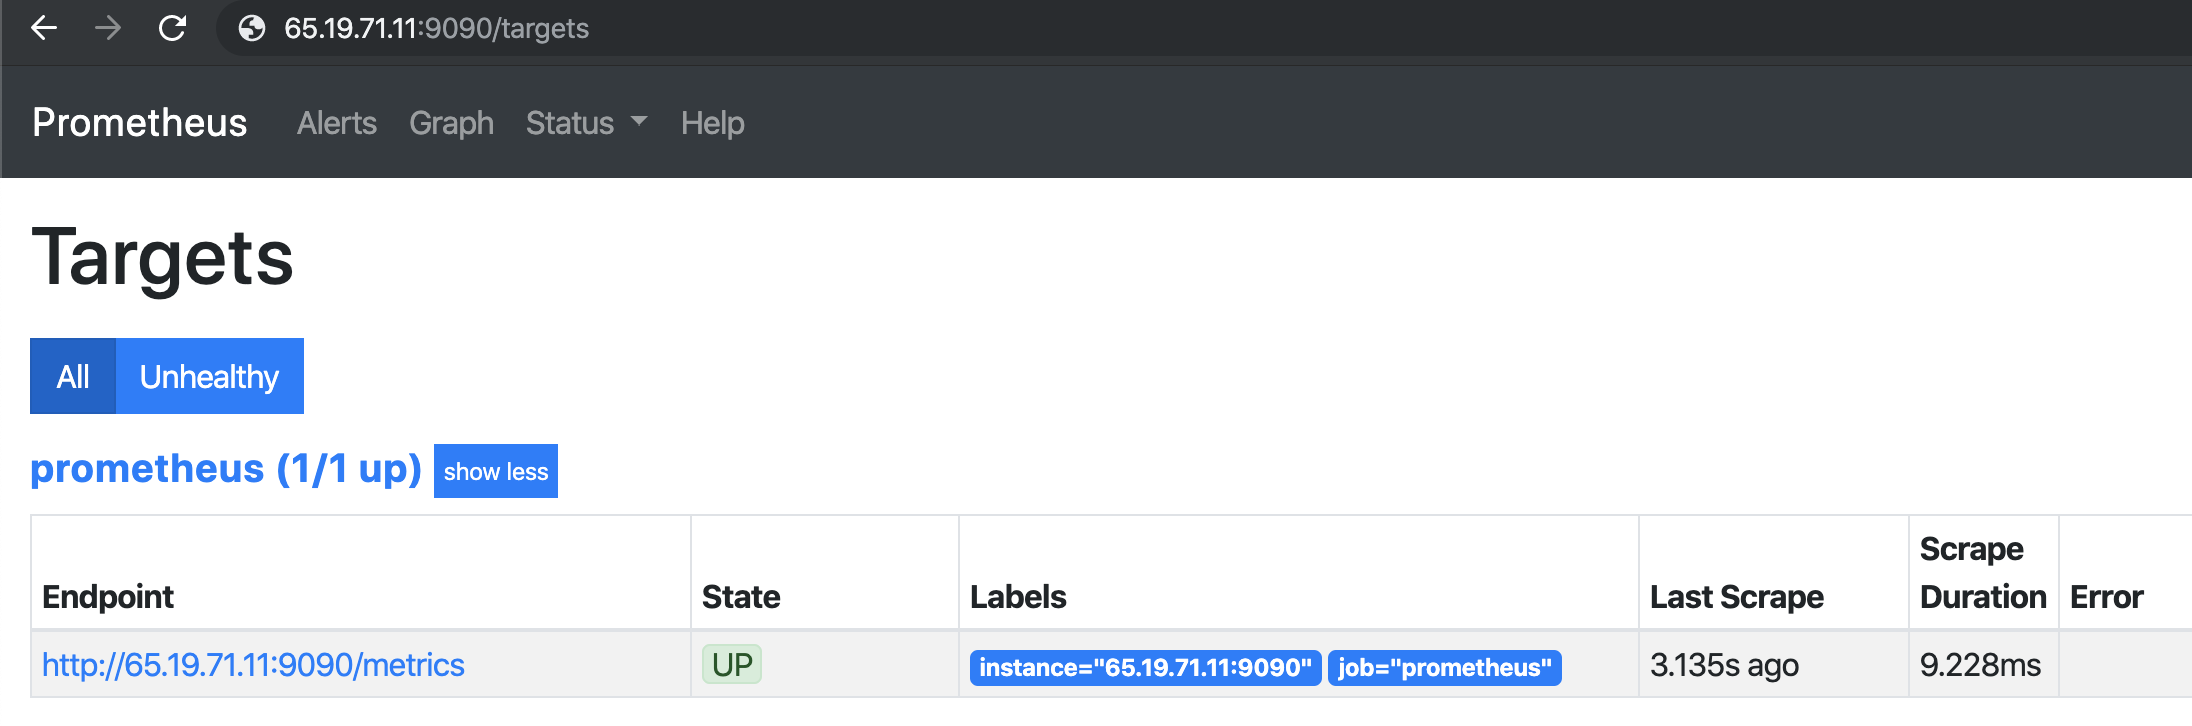
Prometheus를 사용하여 호스트 또는 VM의 UP 상태를 확인하는 방법은 무엇입니까?
|
1 |
URL : http : //65.19.71.11:9090/targets |
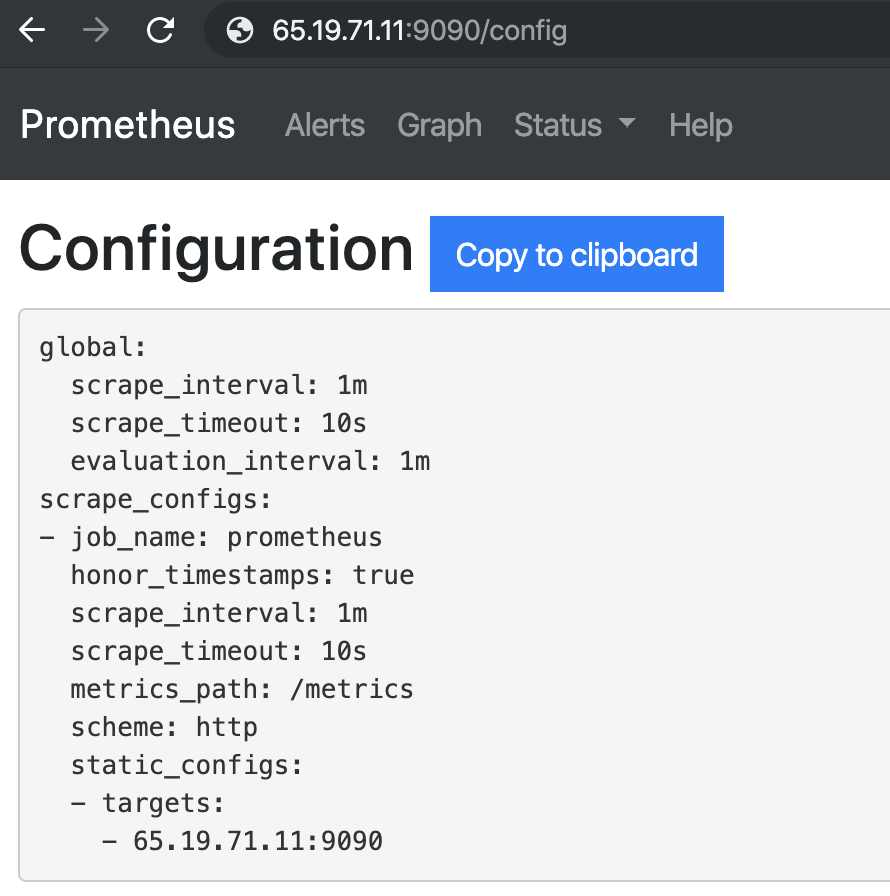
브라우저에서 Prometheus 구성을 확인하는 방법은 무엇입니까?
Prometheus 런타임 정보
|
1 |
URL : http : //65.19.71.11:9090/status |
| 가동 시간 | 2019-08-26 03:07:24.244852166 +0000 UTC |
|---|---|
| 작업 디렉토리 | /프로메테우스 |
| 구성 다시 로드 | 성공적인 |
| 마지막으로 성공한 구성 다시 로드 | 2019-08-26 03:07:24 +0000 UTC |
| 헤드 청크 | 533 |
| 헤드 시계열 | 533 |
| WAL 손상 | 0 |
| 고루틴 | 36 |
| 고맥스프록스 | 1 |
| GOGC | |
| 고데버그 | |
| 스토리지 보유 | 15일 |
프로메테우스 빌드 정보
| 버전 | 2.12.0 |
|---|---|
| 개정 | 43acd0e2e93f9f70c49b2267efa0124f1e759e86 |
| 나뭇 가지 | 머리 |
| 빌드 사용자 | root@7a9dbdbe0cc7 |
| 빌드 날짜 | 20190818-13:53:16 |
| 고버전 | go1.12.8 |
Prometheus 명령줄 플래그:
|
1 |
URL : http : //65.19.71.11:9090/flags |
| alertmanager.notification-대기열 용량 | 10000 |
|---|---|
| alertmanager.timeout | 10초 |
| 설정 파일 | /etc/prometheus/prometheus.yml |
| 로그 형식 | logfmt |
| 로그.레벨 | 정보 |
| query.lookback-delta | 5m |
| query.max-동시성 | 20 |
| query.max-샘플 | 50000000 |
| 쿼리.시간 초과 | 2m |
| rules.alert.for-grace-period | 10m |
| rules.alert.for-outage-tolerance | 1시간 |
| rules.alert.resend-delay | 1m |
| storage.remote.flush-deadline | 1m |
| storage.remote.read-concurrent-limit | 10 |
| storage.remote.read-sample-limit | 50000000 |
| storage.tsdb.allow-overlapping-blocks | 거짓 |
| storage.tsdb.max-block-duration | 36시간 |
| storage.tsdb.min-block-duration | 2시간 |
| storage.tsdb.no-lockfile | 거짓 |
| storage.tsdb.path | /프로메테우스 |
| storage.tsdb.retention | 0초 |
| storage.tsdb.retention.size | 0B |
| storage.tsdb.retention.time | 0초 |
| storage.tsdb.wal-압축 | 거짓 |
| storage.tsdb.wal-segment-size | 0B |
| web.console.libraries | console_libraries |
| web.console.templates | 콘솔 |
| web.cors.origin | .* |
| web.enable-admin-api | 거짓 |
| web.enable-lifecycle | 거짓 |
| web.external-url | |
| web.listen-address | 0.0.0.0:9090 |
| web.max-connections | 512 |
| web.page-title | Prometheus 시계열 수집 및 처리 서버 |
| web.read-timeout | 5m |
| web.route-접두사 | / |
모든 준비가 완료되었습니다. successfully installed Prometheus 하고 모든 기능을 확인했습니다.