
Wie installiere und konfiguriere ich Prometheus unter Linux? (Ubuntu und CentOS)
Veröffentlicht: 2019-08-26
Was ist Prometheus?
Prometheus ist ein erstklassiges Überwachungssystem, das standardmäßig mit einer Zeitreihendatenbank geliefert wird. Es ist ein Open-Source-System, das ursprünglich im Jahr 2012 gebaut wurde.
Die 500 größten Unternehmen der Welt nutzen Prometheus, um Metriken für ihre Infrastruktur und Anwendung zu sammeln. Prometheus unterstützt mehrdimensionale Datenmodelle mit Zeitreihendaten, die hauptsächlich als Metriken identifiziert werden.
Es gibt keine besonderen Anforderungen an die Datenspeicherung, da Prometheus Time Series DB (TSDB) als Teil seiner eigenen Installation verwendet.
In diesem Tutorial installieren wir Prometheus auf Linux Ubuntu und CentOS mit supereinfachen Schritten.
Lass uns anfangen:
Schritt-1 Überprüfen Sie die Version des Linux-Betriebssystems
Befehl: cat /etc/os-release
|
1 2 3 4 5 6 7 8 9 10 11 12 13 |
root @ localhost : ~ # cat /etc/os-release NAME = "Ubuntu" VERSION = "19.04 (Disco Dingo)" ID = ubuntu ID_LIKE = debian PRETTY_NAME = "Ubuntu 19.04" VERSION_ID = "19.04" HOME_URL = "https://www.ubuntu.com/" SUPPORT_URL = "https://help.ubuntu.com/" BUG_REPORT_URL = "https://bugs.launchpad.net/ubuntu/" PRIVACY_POLICY_URL = "https://www.ubuntu.com/legal/terms-and-policies/privacy-policy" VERSION_CODENAME = disco UBUNTU_CODENAME = disco |
Die folgenden Schritte gelten für Ubuntu Linux OS .
Schritt-2 Prometheus-Daten- und Konfigurationsordner erstellen
Befehle :
|
1 2 3 |
root @ localhost : ~ # sudo mkdir /crunchify/prometheus/conf root @ localhost : ~ # sudo mkdir /crunchify/prometheus/data |
Lassen Sie uns beide Ordner überprüfen:
|
1 2 3 4 5 6 7 8 9 |
root @ localhost : / crunchify / prometheus # pwd / crunchify / prometheus root @ localhost : / crunchify / prometheus # ls -ltra total 16 drwxr - xr - x 2 root root 4096 Aug 25 23 : 37 conf drwxr - xr - x 3 root root 4096 Aug 25 23 : 37 . . drwxr - xr - x 2 root root 4096 Aug 25 23 : 37 data drwxr - xr - x 4 root root 4096 Aug 25 23 : 37 . |
Schritt-3 Ändern Sie den Eigentümer des Datenordners
Dies ist erforderlich, um Berechtigungsprobleme in den späteren Schritten zu vermeiden.
|
1 |
root @ localhost : / crunchify / prometheus # sudo chown 65534:65534 /crunchify/prometheus/data/ |
Schritt-4 Erstellen Sie die Datei prometheus.yml
Gehen Sie zum Ordner /crunchify/prometheus/conf und erstellen Sie die Datei prometheus.yml .
|
1 2 3 |
root @ localhost : / # cd /crunchify/prometheus/conf root @ localhost : / crunchify / prometheus / conf # vi prometheus.yml |
Inhalt der Datei prometheus.yml:
|
1 2 3 4 5 6 7 8 9 10 11 12 13 14 15 16 17 18 19 20 21 22 23 24 25 26 27 28 29 |
# my global config global : scrape_interval : 15s # Set the scrape interval to every 15 seconds. Default is every 1 minute. evaluation_interval : 15s # Evaluate rules every 15 seconds. The default is every 1 minute. # scrape_timeout is set to the global default (10s). # Alertmanager configuration alerting : alertmanagers : - static_configs : - targets : # - alertmanager:9093 # Load rules once and periodically evaluate them according to the global 'evaluation_interval'. rule_files : # - "first_rules.yml" # - "second_rules.yml" # A scrape configuration containing exactly one endpoint to scrape: # Here it's Prometheus itself. scrape_configs : # The job name is added as a label `job=<job_name>` to any time series scraped from this config. - job_name : 'prometheus' # metrics_path defaults to '/metrics' # scheme defaults to 'http'. static_configs : - targets : [ '65.19.71.11:9090' ] |
Note: Ersetzen Sie in der obigen Datei die IP durch Ihre Host-/VM-IP.
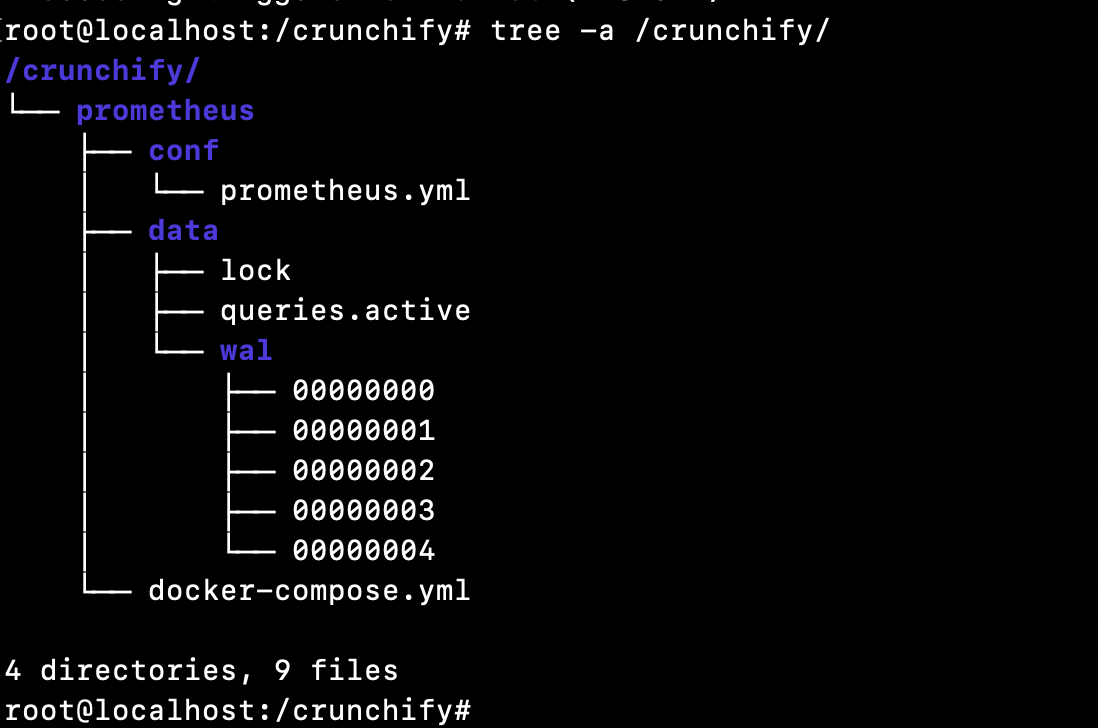
Hier ist eine Directory structure für dieses Tutorial:
Schritt-5 Stellen Sie sicher, dass Sie Docker auf Ihrer VM installiert haben.
Wie überprüfe ich, ob Docker installiert ist oder nicht?
|
1 2 3 |
root @ localhost : ~ # docker Command 'docker' not found |
Das bedeutet, dass Docker nicht auf Ihrem Host/Ihrer VM installiert ist. Bitte folgen Sie dem Docker-Installations-Tutorial vollständig, um Docker auf Ihrem Host/Ihrer VM zu installieren.
Schritt-6 Installieren Sie Docker Compose
Pre-requisiteist, dass Sie zuerst Docker installieren, bevor Sie die folgenden Schritte ausführen. (Schritt-5)
Führen Sie die folgenden drei Befehle aus:
|
1 2 3 4 5 6 7 8 9 |
root @ localhost : ~ # sudo curl -L "https://github.com/docker/compose/releases/download/1.24.1/docker-compose-$(uname -s)-$(uname -m)" -o /usr/local/bin/docker-compose % Total % Received % Xferd Average Speed Time Time Time Current Dload Upload Total Spent Left Speed 100 617 0 617 0 0 2448 0 -- : -- : -- -- : -- : -- -- : -- : -- 2448 100 15.4M 100 15.4M 0 0 11.2M 0 0 : 00 : 01 0 : 00 : 01 -- : -- : -- 15.7M root @ localhost : ~ # sudo chmod +x /usr/local/bin/docker-compose root @ localhost : ~ # sudo ln -s /usr/local/bin/docker-compose /usr/bin/docker-compose |
Schritt-7 Überprüfen Sie die Docker Compose-Version
|
1 2 3 |
root @ localhost : ~ # docker-compose --version docker - compose version 1.24.1 , build 4667896b |
Herzlichen Glückwunsch – docker compose wurde erfolgreich auf Ihrer VM installiert.
Schritt-8 Docker-compose.yml-Datei erstellen
Gehen Sie zum Ordner /crunchify/prometheus.
|
1 2 3 |
root @ localhost : / crunchify # cd /crunchify/prometheus/ root @ localhost : / crunchify / prometheus # vi docker-compose.yml |
Inhalt der docker-compose.yml-Datei:
|
1 2 3 4 5 6 7 8 9 10 11 12 13 14 |
version : "3" services : prometheus : image : prom / prometheus : latest container_name : prometheus volumes : - / crunchify / prometheus / conf : / etc / prometheus - / crunchify / prometheus / data : / prometheus command : - '--config.file=/etc/prometheus/prometheus.yml' - '--storage.tsdb.path=/prometheus' ports : - "9090:9090" |
Schritt-9 Installieren Sie Prometheus Start/Stop als Teil der Systemsteuerung.
Erstellen Sie die Datei vi /etc/systemd/system/prometheus.service
Inhalt der Datei prometheus.service:
|
1 2 3 4 5 6 7 8 9 10 11 12 13 14 15 16 17 |
[ Unit ] Description = Prometheus monitoring docker container After = docker . service BindsTo = docker . service [ Service ] Restart = always WorkingDirectory =/ crunchify / prometheus / # Ubuntu ExecStart =/ usr / bin / docker - compose up ExecStop =/ usr / bin / docker - compose down # CentOS #ExecStart=/usr/bin/docker-compose up #ExecStop=/usr/bin/docker-compose down [ Install ] WantedBy = multi - user . target |

Schritt-10 Starten Sie den Prometheus-Dienst
|
1 2 3 4 5 6 |
root @ localhost : / crunchify / prometheus / config # sudo systemctl daemon-reload root @ localhost : / crunchify / prometheus / config # sudo systemctl enable prometheus Created symlink / etc / systemd / system / multi - user . target . wants / prometheus . service → / etc / systemd / system / prometheus . service . root @ localhost : / crunchify / prometheus / config # sudo systemctl start prometheus |
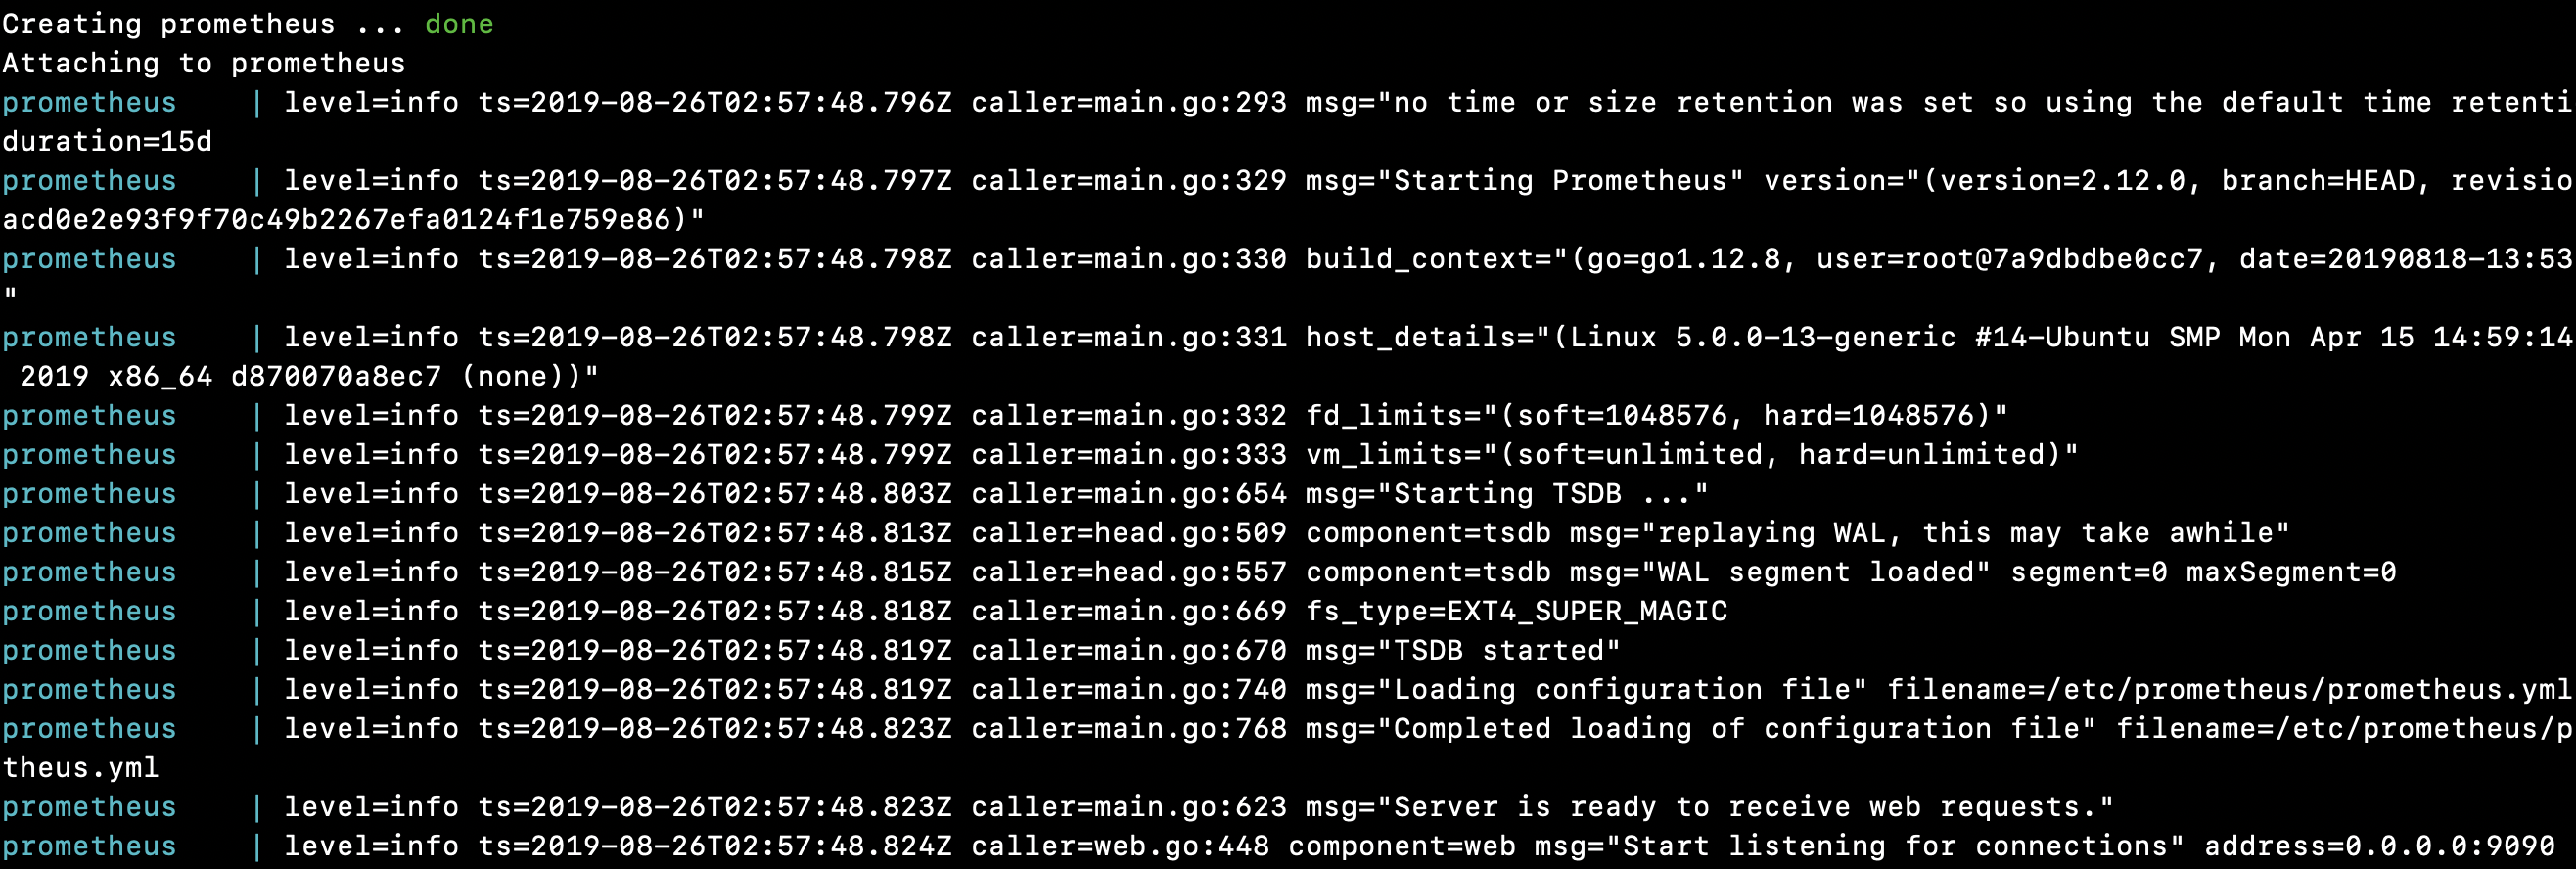
Prometheus-Server unter Linux gestartet:
|
1 2 3 4 5 6 7 8 9 10 11 12 13 14 15 16 17 18 19 20 21 22 23 24 25 26 27 28 29 30 31 32 |
root @ localhost : / crunchify / prometheus # sudo systemctl start prometheus Creating network "prometheus_default" with the default driver Pulling prometheus ( prom / prometheus : latest ) . . . latest : Pulling from prom / prometheus 8e674ad76dce : Pull complete e77d2419d1c2 : Pull complete d7c0a2a2ca7e : Pull complete bd46de67c79d : Pull complete 35f6078df7e9 : Pull complete 8b3f04e26151 : Pull complete 9d234d9c8a77 : Pull complete 1a8a2a4f314d : Pull complete 62e28fd716ec : Pull complete Digest : sha256 : cd93b8711bb92eb9c437d74217311519e0a93bc55779aa664325dc83cd13cb32 Status : Downloaded newer image for prom / prometheus : latest Creating prometheus . . . done Attaching to prometheus prometheus | level = info ts = 2019 - 08 - 26T02 : 57 : 48.796Z caller = main . go : 293 msg = "no time or size retention was set so using the default time retention" duration = 15d prometheus | level = info ts = 2019 - 08 - 26T02 : 57 : 48.797Z caller = main . go : 329 msg = "Starting Prometheus" version = "(version=2.12.0, branch=HEAD, revision=43acd0e2e93f9f70c49b2267efa0124f1e759e86)" prometheus | level = info ts = 2019 - 08 - 26T02 : 57 : 48.798Z caller = main . go : 330 build_context = "(go=go1.12.8, user=root@7a9dbdbe0cc7, date=20190818-13:53:16)" prometheus | level = info ts = 2019 - 08 - 26T02 : 57 : 48.798Z caller = main . go : 331 host_details = "(Linux 5.0.0-13-generic #14-Ubuntu SMP Mon Apr 15 14:59:14 UTC 2019 x86_64 d870070a8ec7 (none))" prometheus | level = info ts = 2019 - 08 - 26T02 : 57 : 48.799Z caller = main . go : 332 fd_limits = "(soft=1048576, hard=1048576)" prometheus | level = info ts = 2019 - 08 - 26T02 : 57 : 48.799Z caller = main . go : 333 vm_limits = "(soft=unlimited, hard=unlimited)" prometheus | level = info ts = 2019 - 08 - 26T02 : 57 : 48.803Z caller = main . go : 654 msg = "Starting TSDB ..." prometheus | level = info ts = 2019 - 08 - 26T02 : 57 : 48.813Z caller = head . go : 509 component = tsdb msg = "replaying WAL, this may take awhile" prometheus | level = info ts = 2019 - 08 - 26T02 : 57 : 48.815Z caller = head . go : 557 component = tsdb msg = "WAL segment loaded" segment = 0 maxSegment = 0 prometheus | level = info ts = 2019 - 08 - 26T02 : 57 : 48.818Z caller = main . go : 669 fs_type = EXT4_SUPER_MAGIC prometheus | level = info ts = 2019 - 08 - 26T02 : 57 : 48.819Z caller = main . go : 670 msg = "TSDB started" prometheus | level = info ts = 2019 - 08 - 26T02 : 57 : 48.819Z caller = main . go : 740 msg = "Loading configuration file" filename =/ etc / prometheus / prometheus . yml prometheus | level = info ts = 2019 - 08 - 26T02 : 57 : 48.823Z caller = main . go : 768 msg = "Completed loading of configuration file" filename =/ etc / prometheus / prometheus . yml prometheus | level = info ts = 2019 - 08 - 26T02 : 57 : 48.823Z caller = main . go : 623 msg = "Server is ready to receive web requests." prometheus | level = info ts = 2019 - 08 - 26T02 : 57 : 48.824Z caller = web . go : 448 component = web msg = "Start listening for connections" address = 0.0.0.0 : 9090 |
Glückwünsche!! Sie haben Prometheus erfolgreich auf Ihrem Host gestartet.
Lassen Sie uns mit Prometheus Dashboard und UI spielen
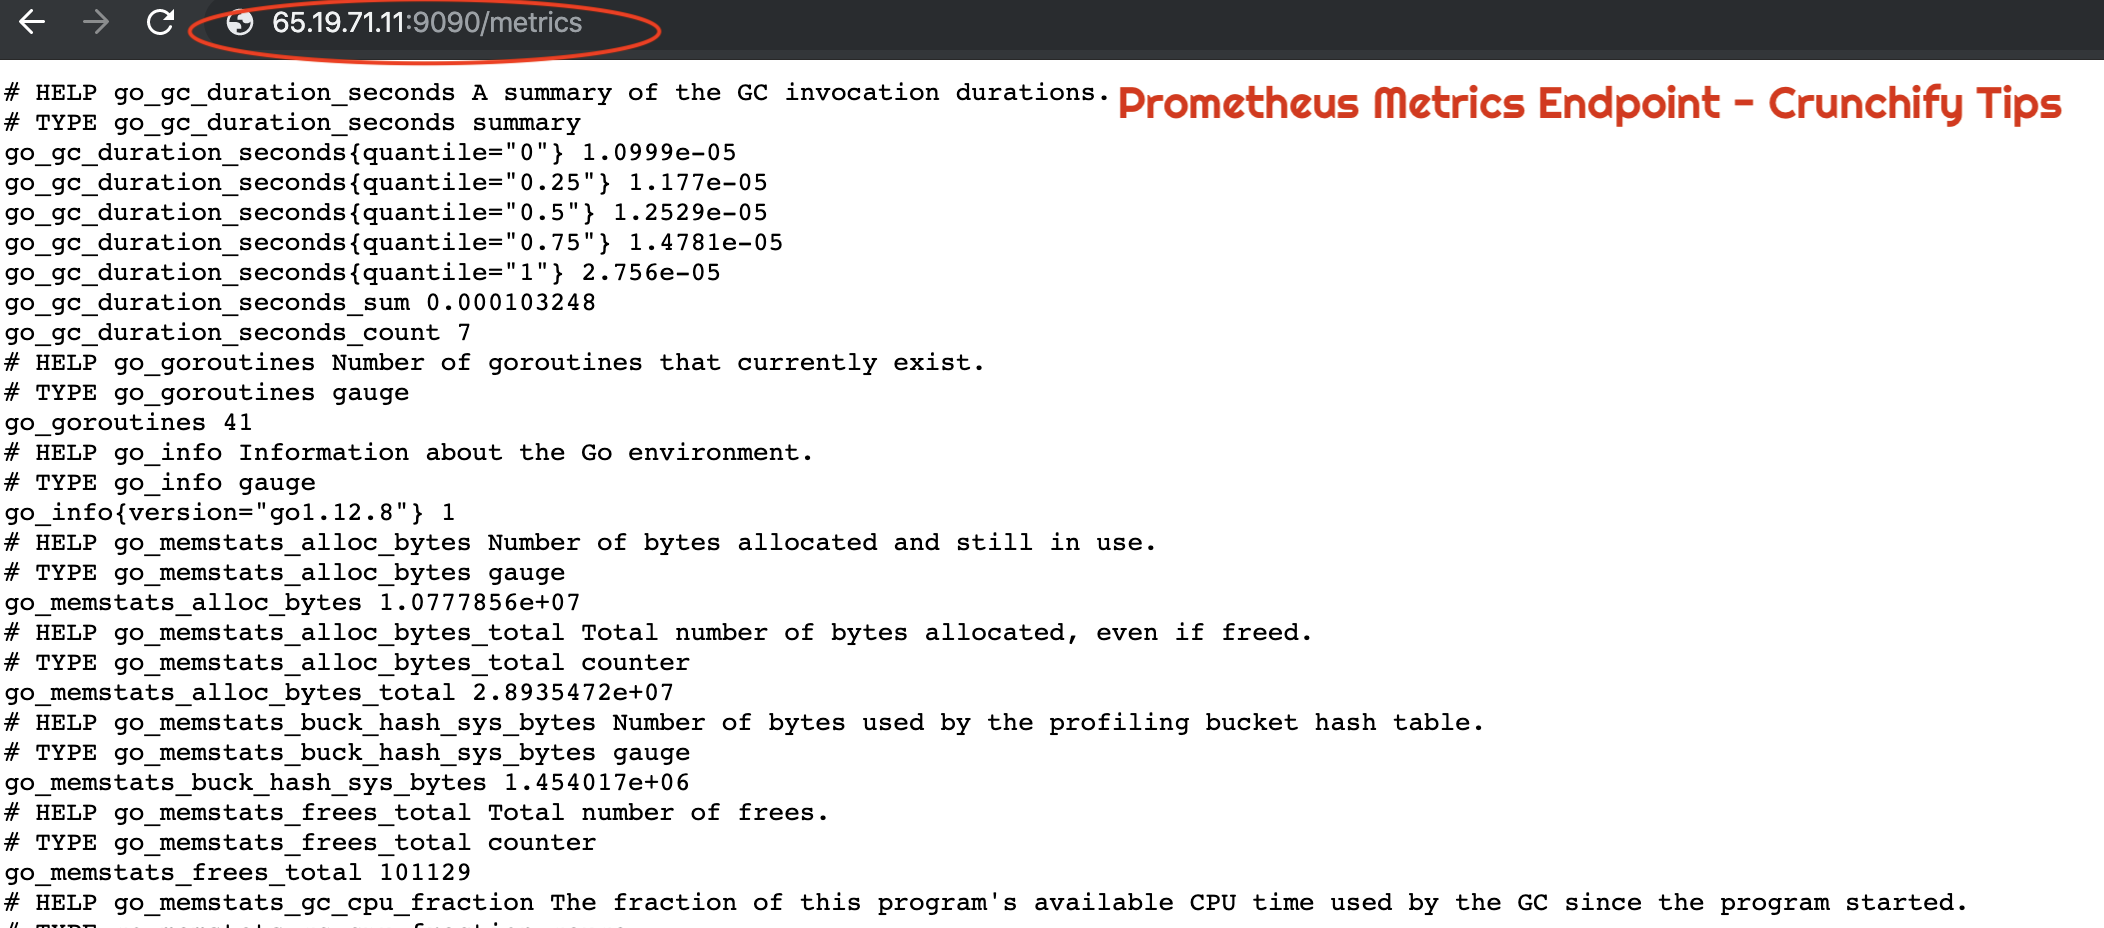
Wie kann ich überprüfen, ob Prometheus korrekt ausgeführt wird oder nicht?
|
1 |
URL : http : //65.19.71.11:9090/metrics |
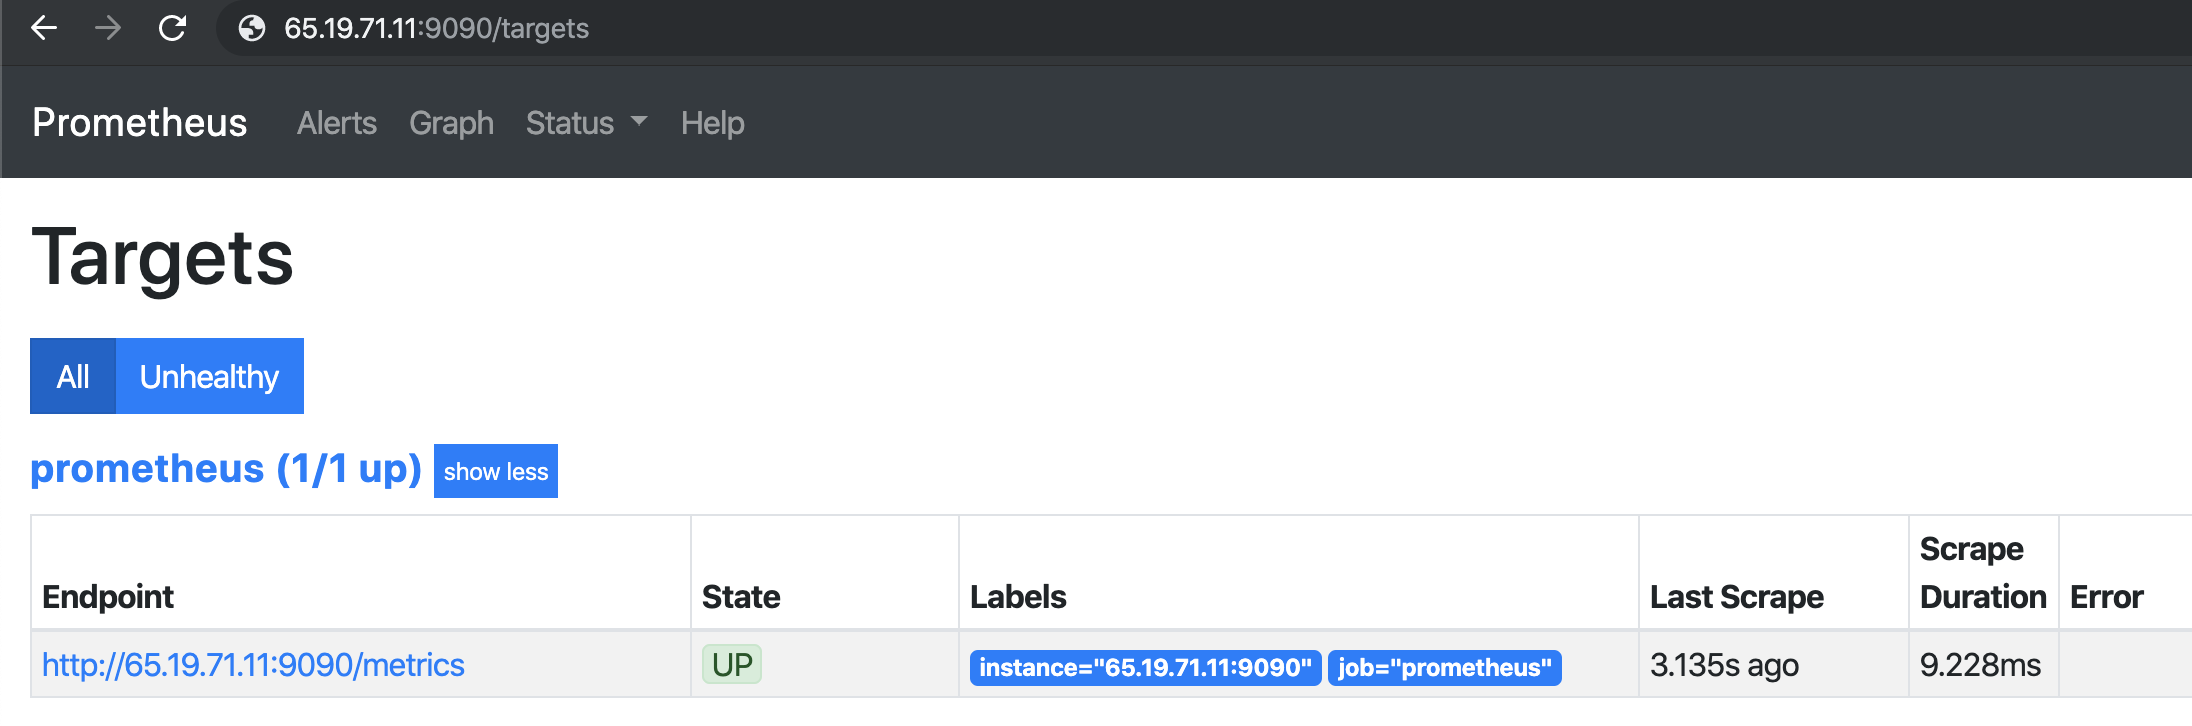
Wie kann ich den UP-Status des Hosts oder der VM mit Prometheus überprüfen?
|
1 |
URL : http : //65.19.71.11:9090/targets |
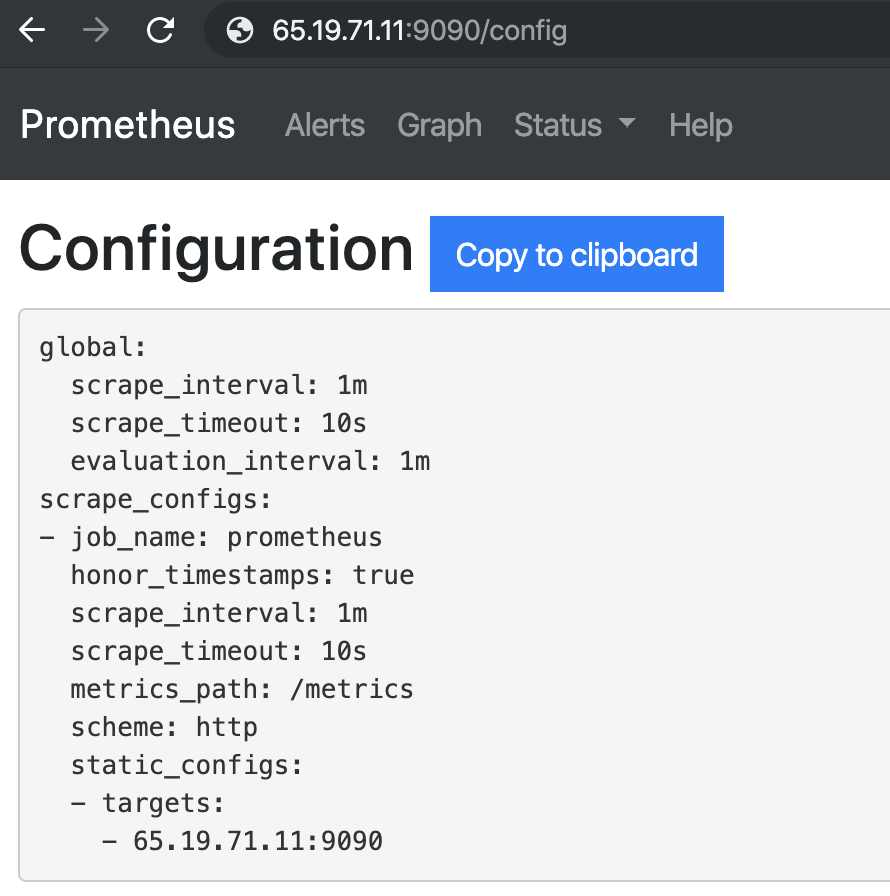
Wie überprüfe ich die Prometheus-Konfiguration im Browser?
Prometheus-Laufzeitinformationen
|
1 |
URL : http : //65.19.71.11:9090/status |
| Betriebszeit | 2019-08-26 03:07:24.244852166 +0000 UTC |
|---|---|
| Arbeitsverzeichnis | /Prometheus |
| Konfiguration neu laden | Erfolgreich |
| Letztes erfolgreiches Neuladen der Konfiguration | 2019-08-26 03:07:24 +0000 UTC |
| Kopfstücke | 533 |
| Kopfzeitreihen | 533 |
| WAL-Korruptionen | 0 |
| Goroutinen | 36 |
| GOMAXPROCS | 1 |
| GOGC | |
| GODEKÄFER | |
| Speicheraufbewahrung | 15d |
Prometheus-Build-Informationen
| Ausführung | 2.12.0 |
|---|---|
| Revision | 43acd0e2e93f9f70c49b2267efa0124f1e759e86 |
| Sich verzeigen | KOPF |
| BuildUser | root@7a9dbdbe0cc7 |
| BuildDate | 20190818-13:53:16 |
| GoVersion | go1.12.8 |
Prometheus-Befehlszeilen-Flags:
|
1 |
URL : http : //65.19.71.11:9090/flags |
| alertmanager.notification-queue-capacity | 10000 |
|---|---|
| alertmanager.timeout | 10s |
| Konfigurationsdatei | /etc/prometheus/prometheus.yml |
| log.format | logfmt |
| log.level | die Info |
| query.lookback-delta | 5m |
| query.max-Parallelität | 20 |
| query.max-Beispiele | 50000000 |
| query.timeout | 2m |
| rules.alert.for-grace-period | 10m |
| regeln.alarm.für-ausfalltoleranz | 1h |
| rules.alert.resend-delay | 1m |
| storage.remote.flush-Deadline | 1m |
| storage.remote.read-concurrent-limit | 10 |
| storage.remote.read-sample-limit | 50000000 |
| storage.tsdb.allow-overlapping-blocks | falsch |
| storage.tsdb.max-block-duration | 36h |
| storage.tsdb.min-block-duration | 2h |
| storage.tsdb.no-lockfile | falsch |
| storage.tsdb.path | /Prometheus |
| storage.tsdb.retention | 0s |
| storage.tsdb.retention.size | 0B |
| storage.tsdb.retention.time | 0s |
| storage.tsdb.wal-Komprimierung | falsch |
| storage.tsdb.wal-Segmentgröße | 0B |
| web.console.libraries | Konsolenbibliotheken |
| web.console.templates | Konsolen |
| web.cors.origin | .* |
| web.enable-admin-api | falsch |
| web.enable-lifecycle | falsch |
| web.externe-url | |
| web.listen-Adresse | 0.0.0.0:9090 |
| web.max-Verbindungen | 512 |
| web.seiten-titel | Prometheus Time Series Collection and Processing Server |
| web.read-timeout | 5m |
| web.route-Präfix | / |
Und Sie sind bereit. Sie haben successfully installed Prometheus und alle Funktionen überprüft.