
Contoh HighChart Spline Dinamis dengan Beberapa Sumbu Y
Diterbitkan: 2013-06-12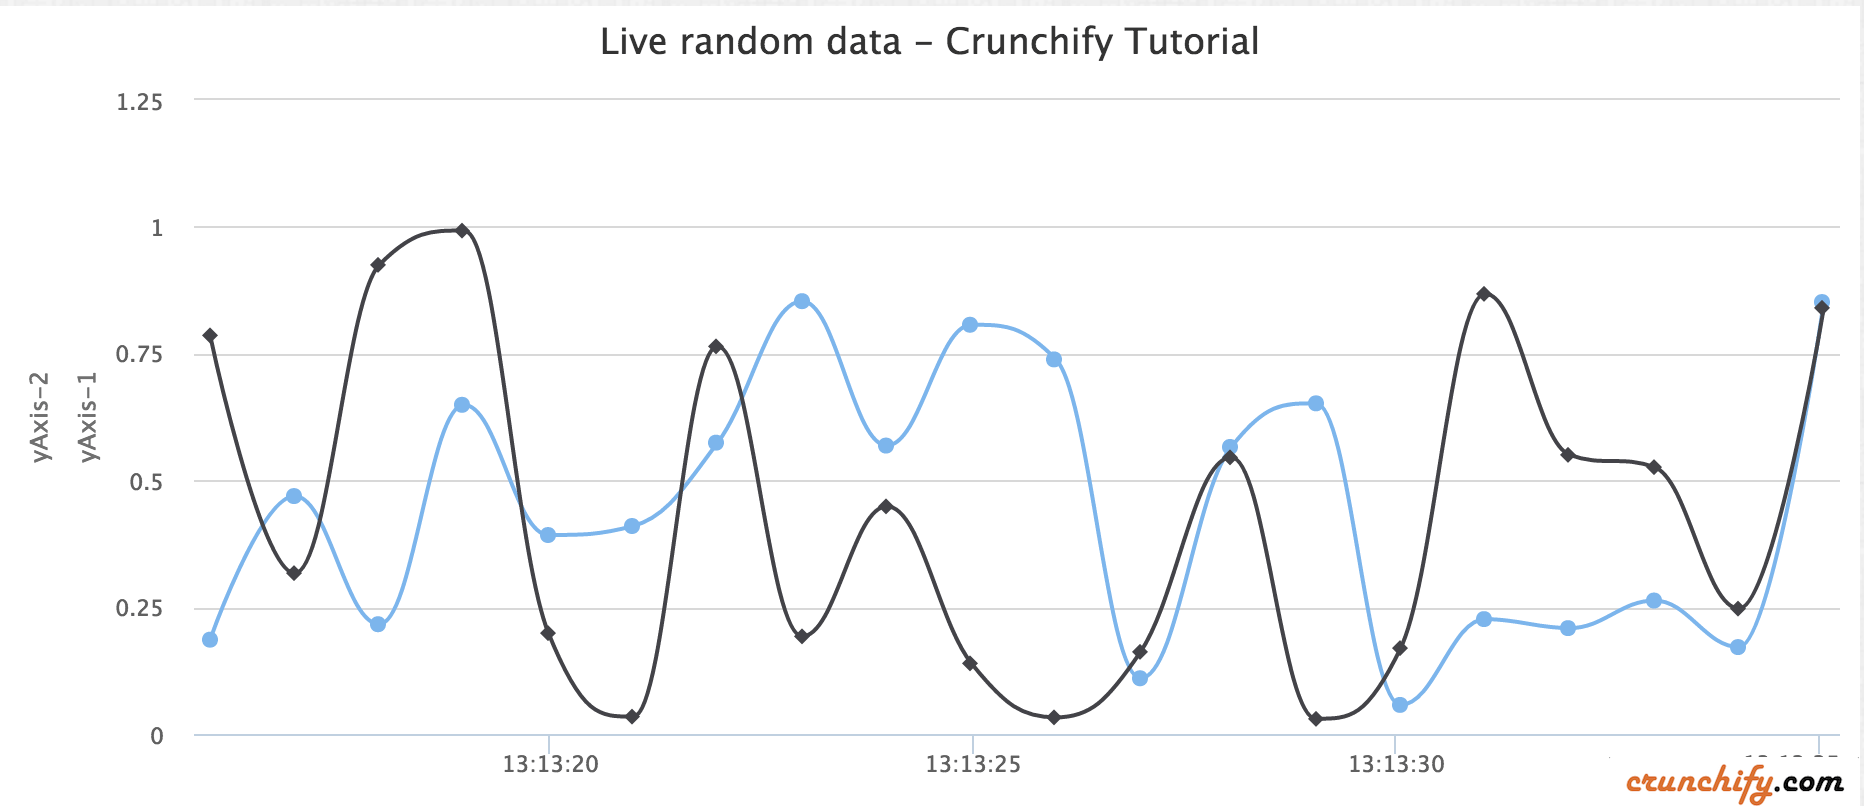
Highcharts adalah pustaka pembuatan bagan yang ditulis dalam HTML5/JavaScript murni, menawarkan bagan intuitif dan interaktif ke situs web atau aplikasi web Anda. Highcharts saat ini mendukung garis, spline, area, areapline, kolom, batang, pai, sebar, pengukur sudut, rentang area, rentang area, rentang kolom, gelembung, plot kotak, bilah kesalahan, saluran, air terjun, dan jenis bagan kutub.
Baru-baru ini saya harus menambahkan sumbu Y lain ke Dynamic Spline Chart. Dengan skrip sederhana di bawah ini Anda dapat menambahkan sumbu y ke-2 dengan sangat mudah.
Demo
Demo dengan dua Nilai Sumbu Y yang berbeda
|
1 2 3 4 5 6 7 8 9 10 11 12 13 14 15 16 17 18 19 20 21 22 23 24 25 26 27 28 29 30 31 32 33 34 35 36 37 38 39 40 41 42 43 44 45 46 47 48 49 50 51 52 53 54 55 56 57 58 59 60 61 62 63 64 65 66 67 68 69 70 71 72 73 74 75 76 77 78 79 80 81 82 83 84 85 86 87 88 89 90 91 92 93 94 95 96 97 98 99 100 101 102 103 104 105 106 107 108 109 110 |
<script> $ ( function ( ) { $ ( document ) . ready ( function ( ) { Highcharts . setOptions ( { global : { useUTC : false } } ) ; var chart ; $ ( '#container' ) . highcharts ( { chart : { type : 'spline' , animation : Highcharts . svg , // don't animate in old IE marginRight : 10 , events : { load : function ( ) { // set up the updating of the chart each second var series = this . series [ 0 ] ; var series2 = this . series [ 1 ] ; setInterval ( function ( ) { var x = ( new Date ( ) ) . getTime ( ) , // current time y = Math . random ( ) ; z = Math . random ( ) ; series . addPoint ( [ x , y ] , false , true ) ; series2 . addPoint ( [ x , z ] , true , true ) ; } , 1000 ) ; } } } , title : { text : 'Live random data' } , xAxis : { type : 'datetime' , tickPixelInterval : 150 } , yAxis : [ { title : { text : 'Value1' } , plotLines : [ { value : 0 , width : 1 , color : '#808080' } ] } , { title : { text : 'Value2' } , plotLines : [ { value : 0 , width : 1 , color : '#808080' } ] } ] , tooltip : { formatter : function ( ) { return '<b>' + this . series . name + '</b><br/>' + Highcharts . dateFormat ( '%Y-%m-%d %H:%M:%S' , this . x ) + '<br/>' + Highcharts . numberFormat ( this . y , 2 ) ; } } , legend : { enabled : false } , exporting : { enabled : false } , series : [ { name : 'Random data' , data : ( function ( ) { // generate an array of random data var data = [ ] , time = ( new Date ( ) ) . getTime ( ) , i ; for ( i = - 19 ; i < = 0 ; i ++ ) { data . push ( { x : time + i * 1000 , y : Math . random ( ) } ) ; } return data ; } ) ( ) } , { name : 'Random data' , data : ( function ( ) { // generate an array of random data var data = [ ] , time = ( new Date ( ) ) . getTime ( ) , i ; for ( i = - 19 ; i < = 0 ; i ++ ) { data . push ( { x : time + i * 1000 , y : Math . random ( ) } ) ; } return data ; } ) ( ) } ] } ) ; } ) ; } ) ; </script> |
Yang lain harus dibaca: JavaScript untuk Memvalidasi Bidang Email & Kata Sandi pada Acara Kirim Formulir

Di bawah ini adalah contoh kode HTML:
|
1 2 3 4 5 6 7 8 9 10 11 12 13 14 15 16 17 |
< HTML > < HEAD > < TITLE > Crunchify - Dynamic Spline HighChart Example with Multiple Y Axis < / TITLE > <script type = "text/javascript" src = "http://code.jquery.com/jquery-1.10.1.min.js" > </script> <script src = "http://code.highcharts.com/highcharts.js" > </script> <script src = "http://code.highcharts.com/modules/exporting.js" > </script> <script> . . . . . above script goes here . . . . </script> < / HEAD > < BODY > < div id = "container" style = "min-width: 728px; height: 400px; margin: 0 auto" > < / div > < / BODY > < / HTML > |