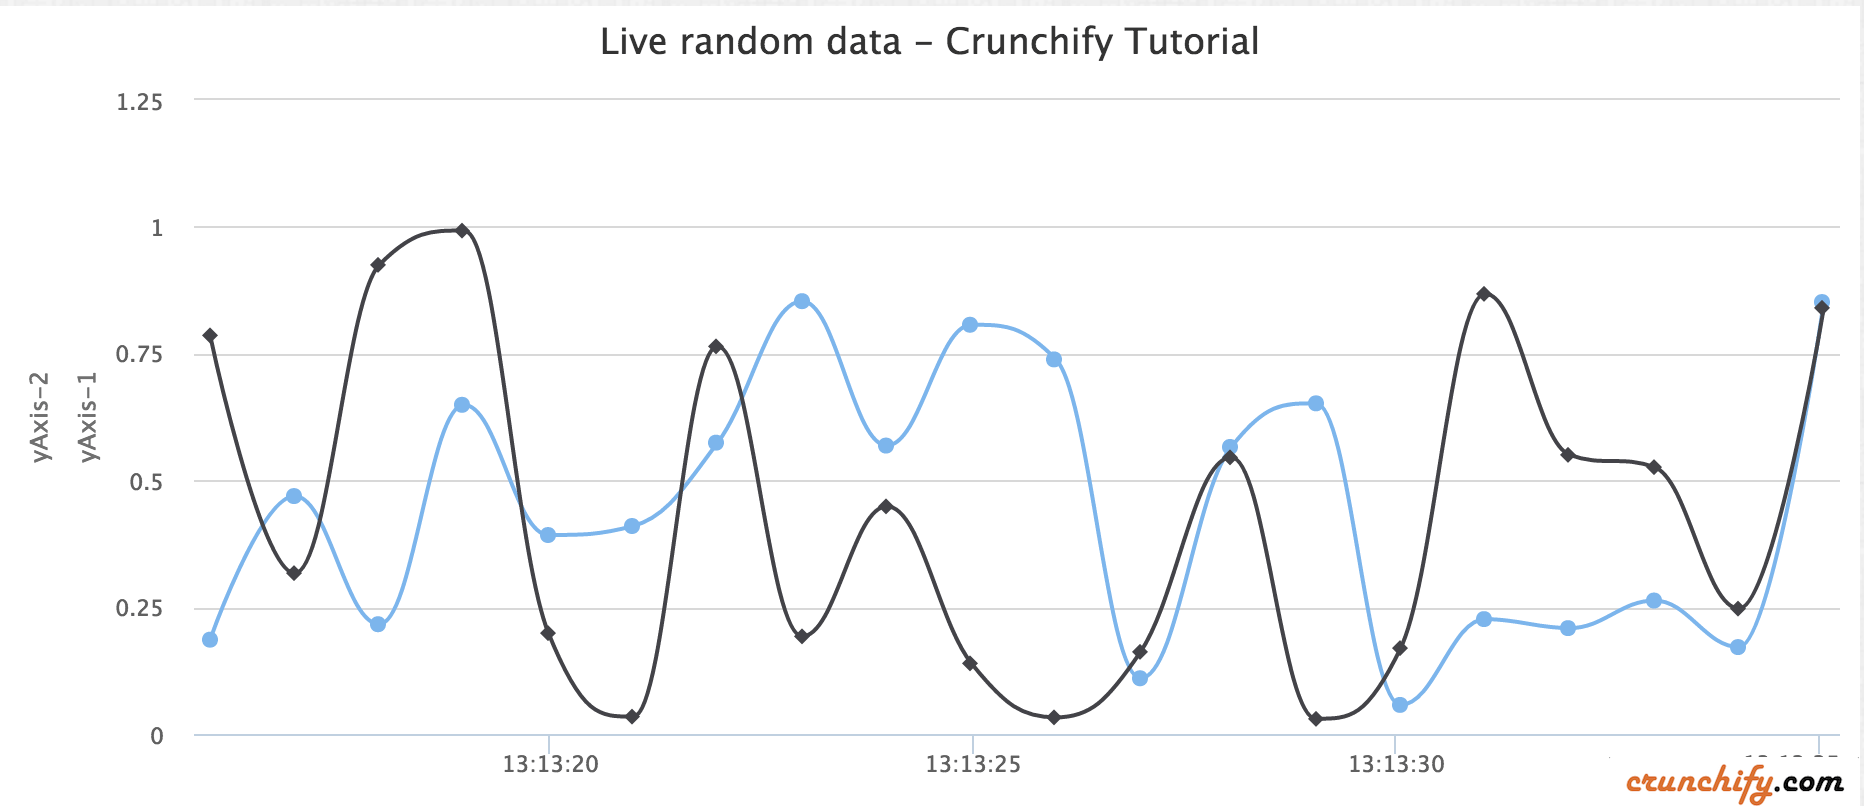
다중 Y축이 있는 동적 스플라인 하이차트 예제
게시 됨: 2013-06-12
Highcharts는 순수 HTML5/JavaScript로 작성된 차트 작성 라이브러리로 웹사이트 또는 웹 애플리케이션에 직관적인 대화형 차트를 제공합니다. Highcharts는 현재 라인, 스플라인, 영역, 에리어스플라인, 컬럼, 바, 파이, 스캐터, 앵귤러 게이지, 에리어레인지, 에리어스플라인레인지, 컬럼레인지, 버블, 박스 플롯, 오차 막대, 깔때기, 폭포 및 극좌표 차트 유형을 지원합니다.
최근에 동적 스플라인 차트에 다른 Y축을 추가해야 합니다. 아래의 간단한 스크립트를 사용하면 두 번째 y축을 매우 쉽게 추가할 수 있습니다.
데모
두 개의 diff Y축 값이 있는 데모
|
1 2 3 4 5 6 7 8 9 10 11 12 13 14 15 16 17 18 19 20 21 22 23 24 25 26 27 28 29 30 31 32 33 34 35 36 37 38 39 40 41 42 43 44 45 46 47 48 49 50 51 52 53 54 55 56 57 58 59 60 61 62 63 64 65 66 67 68 69 70 71 72 73 74 75 76 77 78 79 80 81 82 83 84 85 86 87 88 89 90 91 92 93 94 95 96 97 98 99 100 101 102 103 104 105 106 107 108 109 110 |
<script> $ ( function ( ) { $ ( document ) . ready ( function ( ) { Highcharts . setOptions ( { global : { useUTC : false } } ) ; var chart ; $ ( '#container' ) . highcharts ( { chart : { type : 'spline' , animation : Highcharts . svg , // don't animate in old IE marginRight : 10 , events : { load : function ( ) { // set up the updating of the chart each second var series = this . series [ 0 ] ; var series2 = this . series [ 1 ] ; setInterval ( function ( ) { var x = ( new Date ( ) ) . getTime ( ) , // current time y = Math . random ( ) ; z = Math . random ( ) ; series . addPoint ( [ x , y ] , false , true ) ; series2 . addPoint ( [ x , z ] , true , true ) ; } , 1000 ) ; } } } , title : { text : 'Live random data' } , xAxis : { type : 'datetime' , tickPixelInterval : 150 } , yAxis : [ { title : { text : 'Value1' } , plotLines : [ { value : 0 , width : 1 , color : '#808080' } ] } , { title : { text : 'Value2' } , plotLines : [ { value : 0 , width : 1 , color : '#808080' } ] } ] , tooltip : { formatter : function ( ) { return '<b>' + this . series . name + '</b><br/>' + Highcharts . dateFormat ( '%Y-%m-%d %H:%M:%S' , this . x ) + '<br/>' + Highcharts . numberFormat ( this . y , 2 ) ; } } , legend : { enabled : false } , exporting : { enabled : false } , series : [ { name : 'Random data' , data : ( function ( ) { // generate an array of random data var data = [ ] , time = ( new Date ( ) ) . getTime ( ) , i ; for ( i = - 19 ; i < = 0 ; i ++ ) { data . push ( { x : time + i * 1000 , y : Math . random ( ) } ) ; } return data ; } ) ( ) } , { name : 'Random data' , data : ( function ( ) { // generate an array of random data var data = [ ] , time = ( new Date ( ) ) . getTime ( ) , i ; for ( i = - 19 ; i < = 0 ; i ++ ) { data . push ( { x : time + i * 1000 , y : Math . random ( ) } ) ; } return data ; } ) ( ) } ] } ) ; } ) ; } ) ; </script> |
또 다른 필독 사항: 양식 제출 이벤트에서 이메일 및 비밀번호 필드를 검증하는 JavaScript

다음은 샘플 HTML 코드입니다.
|
1 2 3 4 5 6 7 8 9 10 11 12 13 14 15 16 17 |
< HTML > < HEAD > < TITLE > Crunchify - Dynamic Spline HighChart Example with Multiple Y Axis < / TITLE > <script type = "text/javascript" src = "http://code.jquery.com/jquery-1.10.1.min.js" > </script> <script src = "http://code.highcharts.com/highcharts.js" > </script> <script src = "http://code.highcharts.com/modules/exporting.js" > </script> <script> . . . . . above script goes here . . . . </script> < / HEAD > < BODY > < div id = "container" style = "min-width: 728px; height: 400px; margin: 0 auto" > < / div > < / BODY > < / HTML > |
