
Exemplu Dynamic Spline HighChart cu mai multe axe Y
Publicat: 2013-06-12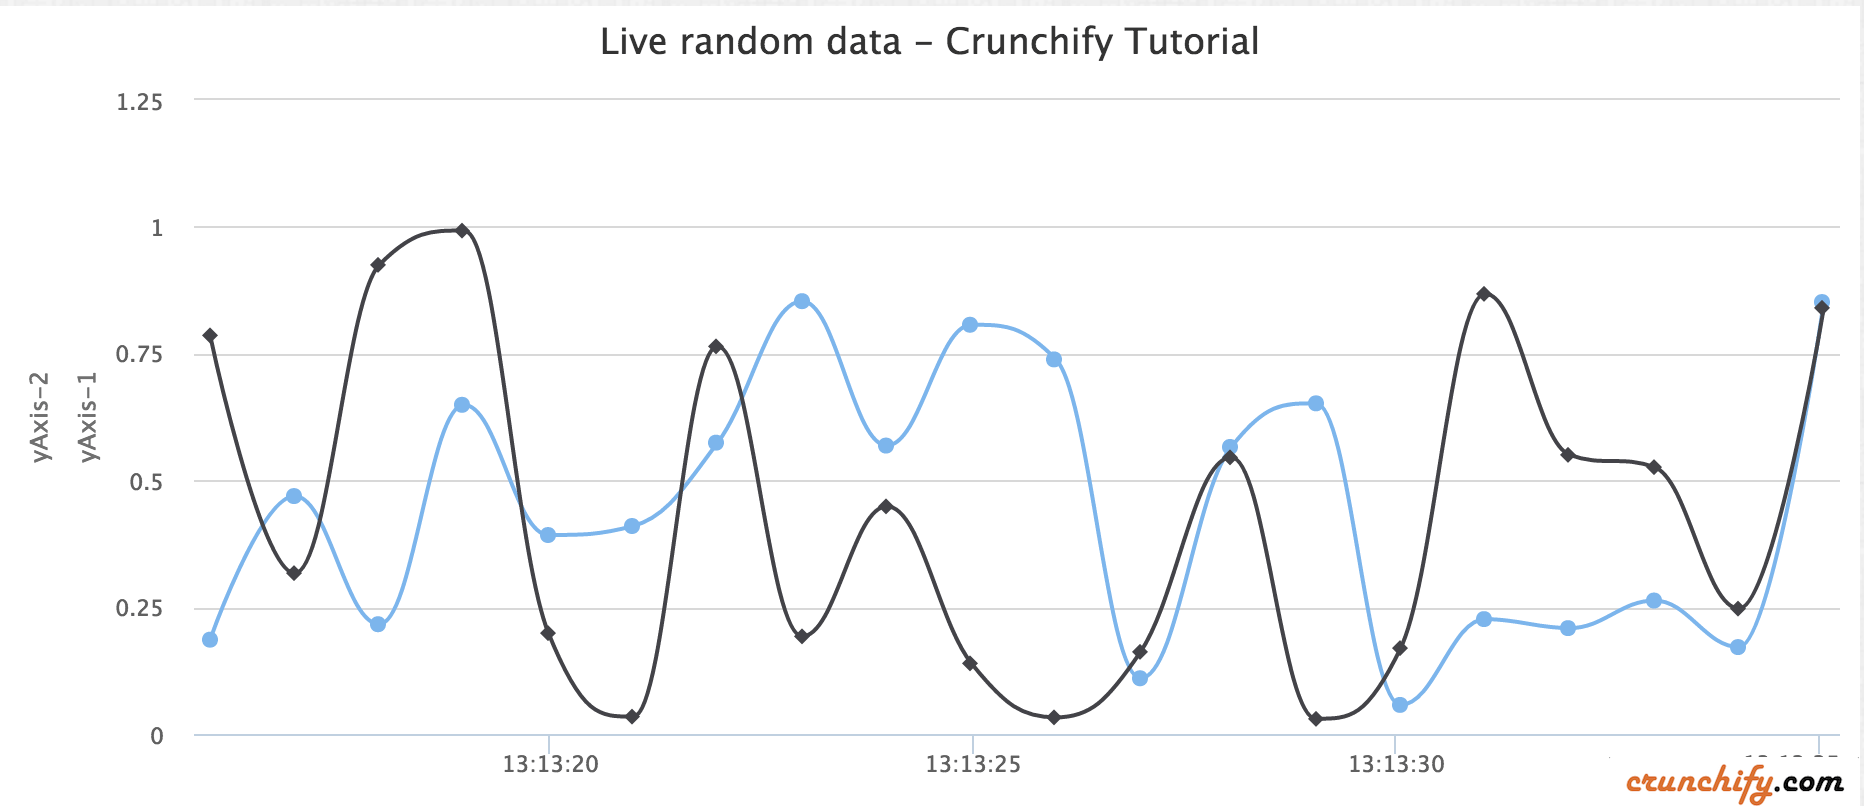
Highcharts este o bibliotecă de diagrame scrisă în pur HTML5/JavaScript, care oferă diagrame intuitive, interactive site-ului sau aplicației dvs. web. Highcharts acceptă în prezent linie, spline, zonă, arespline, coloană, bară, plăcintă, împrăștiere, calibre unghiulare, arearange, areasplinerange, columnrange, bubble, box plot, bare de eroare, pâlnie, cascadă și diagrame polare.
Recent, trebuie să adaug o altă axă Y la diagrama cu spline dinamice. Cu scriptul simplu de mai jos puteți adăuga a doua axa y foarte ușor.
Demo
Demo cu două valori diferite ale axei Y
|
1 2 3 4 5 6 7 8 9 10 11 12 13 14 15 16 17 18 19 20 21 22 23 24 25 26 27 28 29 30 31 32 33 34 35 36 37 38 39 40 41 42 43 44 45 46 47 48 49 50 51 52 53 54 55 56 57 58 59 60 61 62 63 64 65 66 67 68 69 70 71 72 73 74 75 76 77 78 79 80 81 82 83 84 85 86 87 88 89 90 91 92 93 94 95 96 97 98 99 100 101 102 103 104 105 106 107 108 109 110 |
<script> $ ( function ( ) { $ ( document ) . ready ( function ( ) { Highcharts . setOptions ( { global : { useUTC : false } } ) ; var chart ; $ ( '#container' ) . highcharts ( { chart : { type : 'spline' , animation : Highcharts . svg , // don't animate in old IE marginRight : 10 , events : { load : function ( ) { // set up the updating of the chart each second var series = this . series [ 0 ] ; var series2 = this . series [ 1 ] ; setInterval ( function ( ) { var x = ( new Date ( ) ) . getTime ( ) , // current time y = Math . random ( ) ; z = Math . random ( ) ; series . addPoint ( [ x , y ] , false , true ) ; series2 . addPoint ( [ x , z ] , true , true ) ; } , 1000 ) ; } } } , title : { text : 'Live random data' } , xAxis : { type : 'datetime' , tickPixelInterval : 150 } , yAxis : [ { title : { text : 'Value1' } , plotLines : [ { value : 0 , width : 1 , color : '#808080' } ] } , { title : { text : 'Value2' } , plotLines : [ { value : 0 , width : 1 , color : '#808080' } ] } ] , tooltip : { formatter : function ( ) { return '<b>' + this . series . name + '</b><br/>' + Highcharts . dateFormat ( '%Y-%m-%d %H:%M:%S' , this . x ) + '<br/>' + Highcharts . numberFormat ( this . y , 2 ) ; } } , legend : { enabled : false } , exporting : { enabled : false } , series : [ { name : 'Random data' , data : ( function ( ) { // generate an array of random data var data = [ ] , time = ( new Date ( ) ) . getTime ( ) , i ; for ( i = - 19 ; i < = 0 ; i ++ ) { data . push ( { x : time + i * 1000 , y : Math . random ( ) } ) ; } return data ; } ) ( ) } , { name : 'Random data' , data : ( function ( ) { // generate an array of random data var data = [ ] , time = ( new Date ( ) ) . getTime ( ) , i ; for ( i = - 19 ; i < = 0 ; i ++ ) { data . push ( { x : time + i * 1000 , y : Math . random ( ) } ) ; } return data ; } ) ( ) } ] } ) ; } ) ; } ) ; </script> |
Un alt trebuie să citească: JavaScript pentru a valida câmpurile de e-mail și parolă în evenimentul de trimitere a formularului

Mai jos este un exemplu de cod HTML:
|
1 2 3 4 5 6 7 8 9 10 11 12 13 14 15 16 17 |
< HTML > < HEAD > < TITLE > Crunchify - Dynamic Spline HighChart Example with Multiple Y Axis < / TITLE > <script type = "text/javascript" src = "http://code.jquery.com/jquery-1.10.1.min.js" > </script> <script src = "http://code.highcharts.com/highcharts.js" > </script> <script src = "http://code.highcharts.com/modules/exporting.js" > </script> <script> . . . . . above script goes here . . . . </script> < / HEAD > < BODY > < div id = "container" style = "min-width: 728px; height: 400px; margin: 0 auto" > < / div > < / BODY > < / HTML > |