
Exemplo de gráfico dinâmico de spline com vários eixos Y
Publicados: 2013-06-12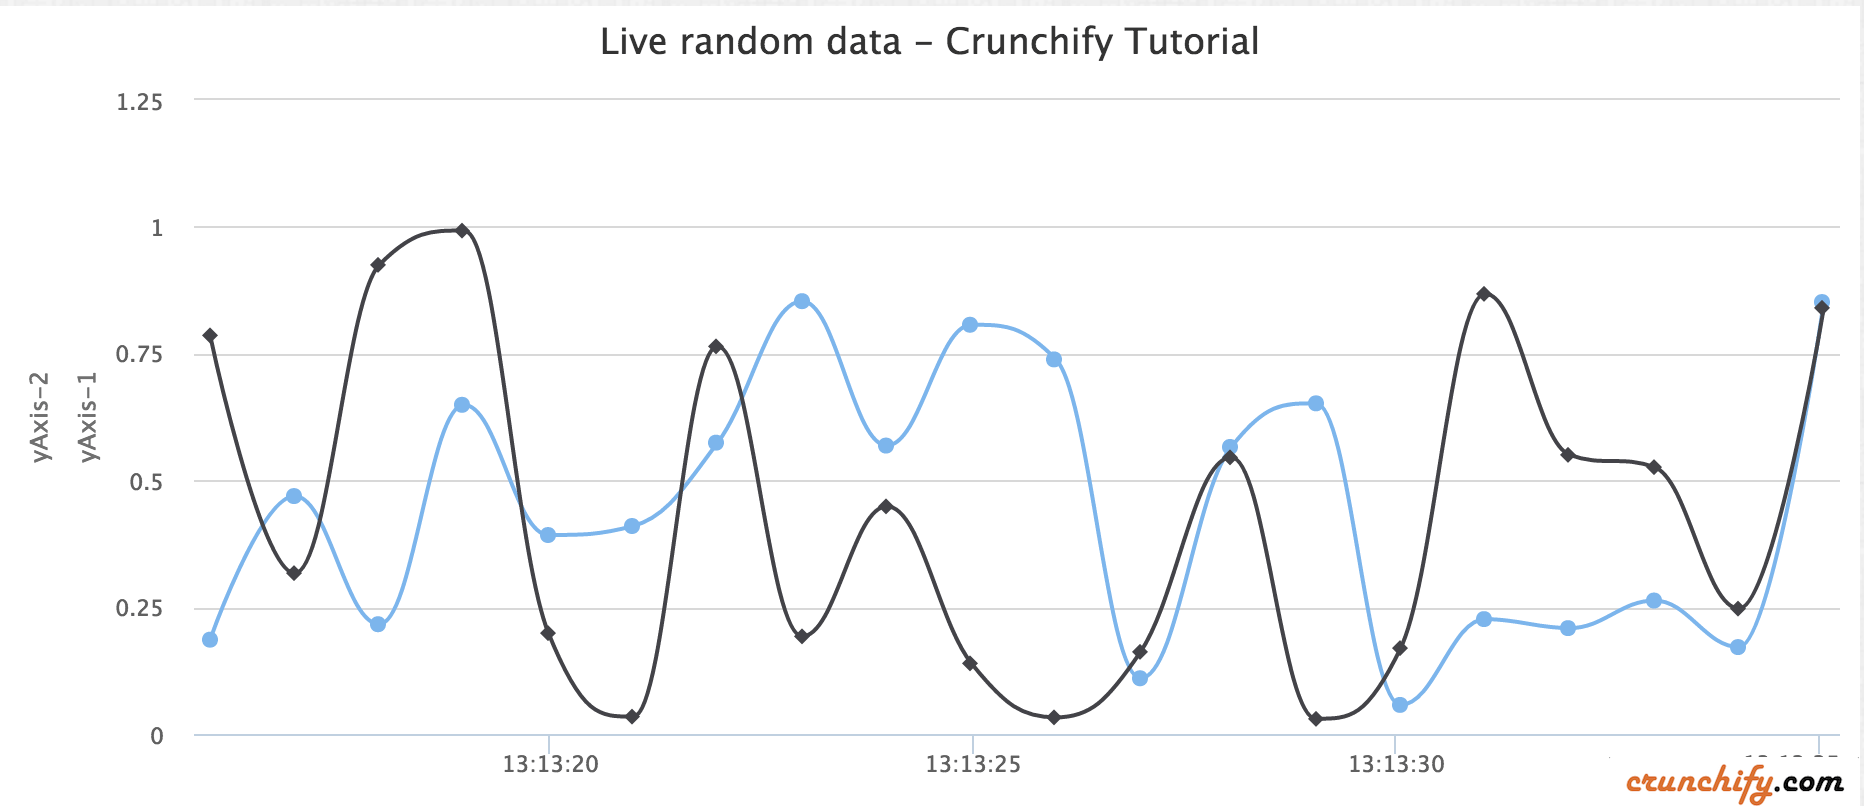
Highcharts é uma biblioteca de gráficos escrita em HTML5/JavaScript puro, oferecendo gráficos intuitivos e interativos para seu site ou aplicativo da web. Highcharts atualmente suporta linha, spline, área, areaspline, coluna, barra, pizza, dispersão, medidores angulares, arearange, areasplinerange, columnrange, bolha, box plot, barras de erro, funil, cascata e tipos de gráfico polar.
Recentemente eu tenho que adicionar outro eixo Y ao gráfico de spline dinâmico. Com o script simples abaixo, você pode adicionar o 2º eixo y com muita facilidade.
Demonstração
Demonstração com dois valores do eixo Y diff
|
1 2 3 4 5 6 7 8 9 10 11 12 13 14 15 16 17 18 19 20 21 22 23 24 25 26 27 28 29 30 31 32 33 34 35 36 37 38 39 40 41 42 43 44 45 46 47 48 49 50 51 52 53 54 55 56 57 58 59 60 61 62 63 64 65 66 67 68 69 70 71 72 73 74 75 76 77 78 79 80 81 82 83 84 85 86 87 88 89 90 91 92 93 94 95 96 97 98 99 100 101 102 103 104 105 106 107 108 109 110 |
<script> $ ( function ( ) { $ ( document ) . ready ( function ( ) { Highcharts . setOptions ( { global : { useUTC : false } } ) ; var chart ; $ ( '#container' ) . highcharts ( { chart : { type : 'spline' , animation : Highcharts . svg , // don't animate in old IE marginRight : 10 , events : { load : function ( ) { // set up the updating of the chart each second var series = this . series [ 0 ] ; var series2 = this . series [ 1 ] ; setInterval ( function ( ) { var x = ( new Date ( ) ) . getTime ( ) , // current time y = Math . random ( ) ; z = Math . random ( ) ; series . addPoint ( [ x , y ] , false , true ) ; series2 . addPoint ( [ x , z ] , true , true ) ; } , 1000 ) ; } } } , title : { text : 'Live random data' } , xAxis : { type : 'datetime' , tickPixelInterval : 150 } , yAxis : [ { title : { text : 'Value1' } , plotLines : [ { value : 0 , width : 1 , color : '#808080' } ] } , { title : { text : 'Value2' } , plotLines : [ { value : 0 , width : 1 , color : '#808080' } ] } ] , tooltip : { formatter : function ( ) { return '<b>' + this . series . name + '</b><br/>' + Highcharts . dateFormat ( '%Y-%m-%d %H:%M:%S' , this . x ) + '<br/>' + Highcharts . numberFormat ( this . y , 2 ) ; } } , legend : { enabled : false } , exporting : { enabled : false } , series : [ { name : 'Random data' , data : ( function ( ) { // generate an array of random data var data = [ ] , time = ( new Date ( ) ) . getTime ( ) , i ; for ( i = - 19 ; i < = 0 ; i ++ ) { data . push ( { x : time + i * 1000 , y : Math . random ( ) } ) ; } return data ; } ) ( ) } , { name : 'Random data' , data : ( function ( ) { // generate an array of random data var data = [ ] , time = ( new Date ( ) ) . getTime ( ) , i ; for ( i = - 19 ; i < = 0 ; i ++ ) { data . push ( { x : time + i * 1000 , y : Math . random ( ) } ) ; } return data ; } ) ( ) } ] } ) ; } ) ; } ) ; </script> |
Outro deve ler: JavaScript para validar campos de e-mail e senha no evento de envio de formulário

Abaixo está um exemplo de código HTML:
|
1 2 3 4 5 6 7 8 9 10 11 12 13 14 15 16 17 |
< HTML > < HEAD > < TITLE > Crunchify - Dynamic Spline HighChart Example with Multiple Y Axis < / TITLE > <script type = "text/javascript" src = "http://code.jquery.com/jquery-1.10.1.min.js" > </script> <script src = "http://code.highcharts.com/highcharts.js" > </script> <script src = "http://code.highcharts.com/modules/exporting.js" > </script> <script> . . . . . above script goes here . . . . </script> < / HEAD > < BODY > < div id = "container" style = "min-width: 728px; height: 400px; margin: 0 auto" > < / div > < / BODY > < / HTML > |