
Ejemplo de Dynamic Spline HighChart con varios ejes Y
Publicado: 2013-06-12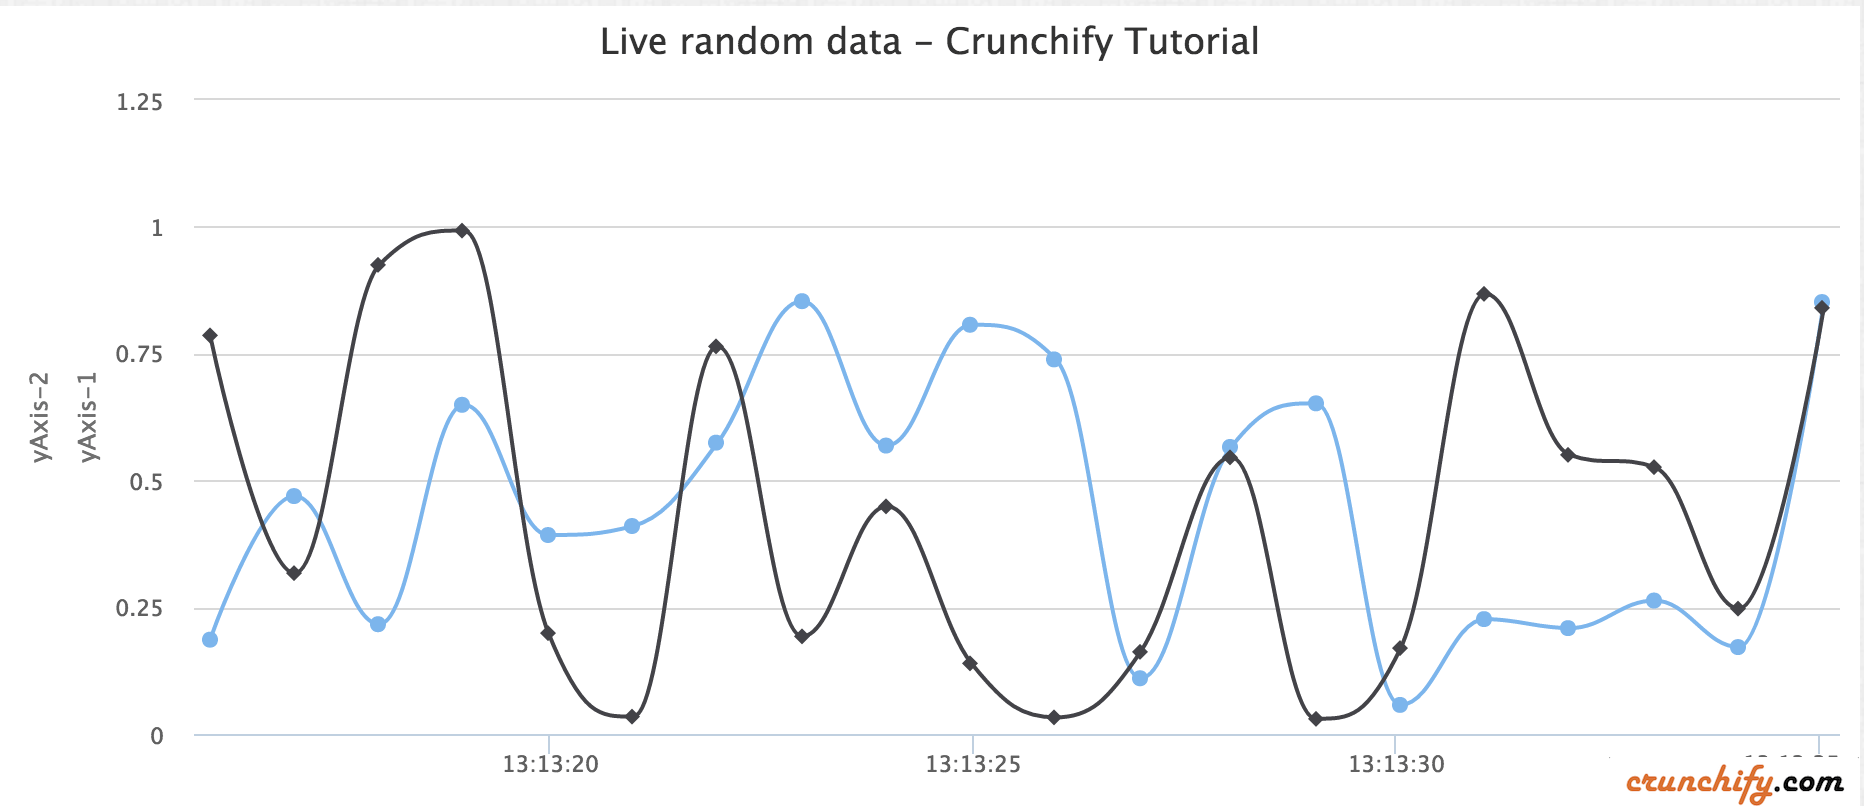
Highcharts es una biblioteca de gráficos escrita en HTML5/JavaScript puro, que ofrece gráficos intuitivos e interactivos para su sitio web o aplicación web. Actualmente, Highcharts admite gráficos de línea, spline, área, areaspline, columna, barra, pastel, dispersión, indicadores angulares, rango de área, rango de áreaspline, rango de columna, burbuja, diagrama de caja, barras de error, embudo, cascada y polar.
Recientemente, tengo que agregar otro eje Y al gráfico dinámico de spline. Con el siguiente script simple, puede agregar el segundo eje y muy fácilmente.
Manifestación
Demostración con dos valores diferenciales del eje Y
|
1 2 3 4 5 6 7 8 9 10 11 12 13 14 15 16 17 18 19 20 21 22 23 24 25 26 27 28 29 30 31 32 33 34 35 36 37 38 39 40 41 42 43 44 45 46 47 48 49 50 51 52 53 54 55 56 57 58 59 60 61 62 63 64 65 66 67 68 69 70 71 72 73 74 75 76 77 78 79 80 81 82 83 84 85 86 87 88 89 90 91 92 93 94 95 96 97 98 99 100 101 102 103 104 105 106 107 108 109 110 |
<script> $ ( function ( ) { $ ( document ) . ready ( function ( ) { Highcharts . setOptions ( { global : { useUTC : false } } ) ; var chart ; $ ( '#container' ) . highcharts ( { chart : { type : 'spline' , animation : Highcharts . svg , // don't animate in old IE marginRight : 10 , events : { load : function ( ) { // set up the updating of the chart each second var series = this . series [ 0 ] ; var series2 = this . series [ 1 ] ; setInterval ( function ( ) { var x = ( new Date ( ) ) . getTime ( ) , // current time y = Math . random ( ) ; z = Math . random ( ) ; series . addPoint ( [ x , y ] , false , true ) ; series2 . addPoint ( [ x , z ] , true , true ) ; } , 1000 ) ; } } } , title : { text : 'Live random data' } , xAxis : { type : 'datetime' , tickPixelInterval : 150 } , yAxis : [ { title : { text : 'Value1' } , plotLines : [ { value : 0 , width : 1 , color : '#808080' } ] } , { title : { text : 'Value2' } , plotLines : [ { value : 0 , width : 1 , color : '#808080' } ] } ] , tooltip : { formatter : function ( ) { return '<b>' + this . series . name + '</b><br/>' + Highcharts . dateFormat ( '%Y-%m-%d %H:%M:%S' , this . x ) + '<br/>' + Highcharts . numberFormat ( this . y , 2 ) ; } } , legend : { enabled : false } , exporting : { enabled : false } , series : [ { name : 'Random data' , data : ( function ( ) { // generate an array of random data var data = [ ] , time = ( new Date ( ) ) . getTime ( ) , i ; for ( i = - 19 ; i < = 0 ; i ++ ) { data . push ( { x : time + i * 1000 , y : Math . random ( ) } ) ; } return data ; } ) ( ) } , { name : 'Random data' , data : ( function ( ) { // generate an array of random data var data = [ ] , time = ( new Date ( ) ) . getTime ( ) , i ; for ( i = - 19 ; i < = 0 ; i ++ ) { data . push ( { x : time + i * 1000 , y : Math . random ( ) } ) ; } return data ; } ) ( ) } ] } ) ; } ) ; } ) ; </script> |
Otro debe leer: JavaScript para validar los campos de correo electrónico y contraseña en el evento de envío de formulario

A continuación se muestra un ejemplo de código HTML:
|
1 2 3 4 5 6 7 8 9 10 11 12 13 14 15 16 17 |
< HTML > < HEAD > < TITLE > Crunchify - Dynamic Spline HighChart Example with Multiple Y Axis < / TITLE > <script type = "text/javascript" src = "http://code.jquery.com/jquery-1.10.1.min.js" > </script> <script src = "http://code.highcharts.com/highcharts.js" > </script> <script src = "http://code.highcharts.com/modules/exporting.js" > </script> <script> . . . . . above script goes here . . . . </script> < / HEAD > < BODY > < div id = "container" style = "min-width: 728px; height: 400px; margin: 0 auto" > < / div > < / BODY > < / HTML > |